Dive into the heart of our solar system with live, near-real-time images of the Sun, captured by the GOES-19, SDO, and other NOAA/NASA satellites. Stay updated on the latest solar activity, coronal mass ejections, solar wind activity, and aurora predictions. Whether you’re an astrophysics enthusiast or a solar observer, this dashboard provides a direct window into the Sun’s dynamic activity. These real-time images help us track solar flares, coronal mass ejections (CMEs), and other solar phenomena that affect space weather and can influence Earth’s environment.
Latest Ultra-Violet Images of the Sun
These are the latest images from GOES-19 SUVI (Solar Ultra Violet Imager), which captures images of the Sun in extreme ultraviolet wavelengths, offering a glimpse into different layers of its atmosphere.
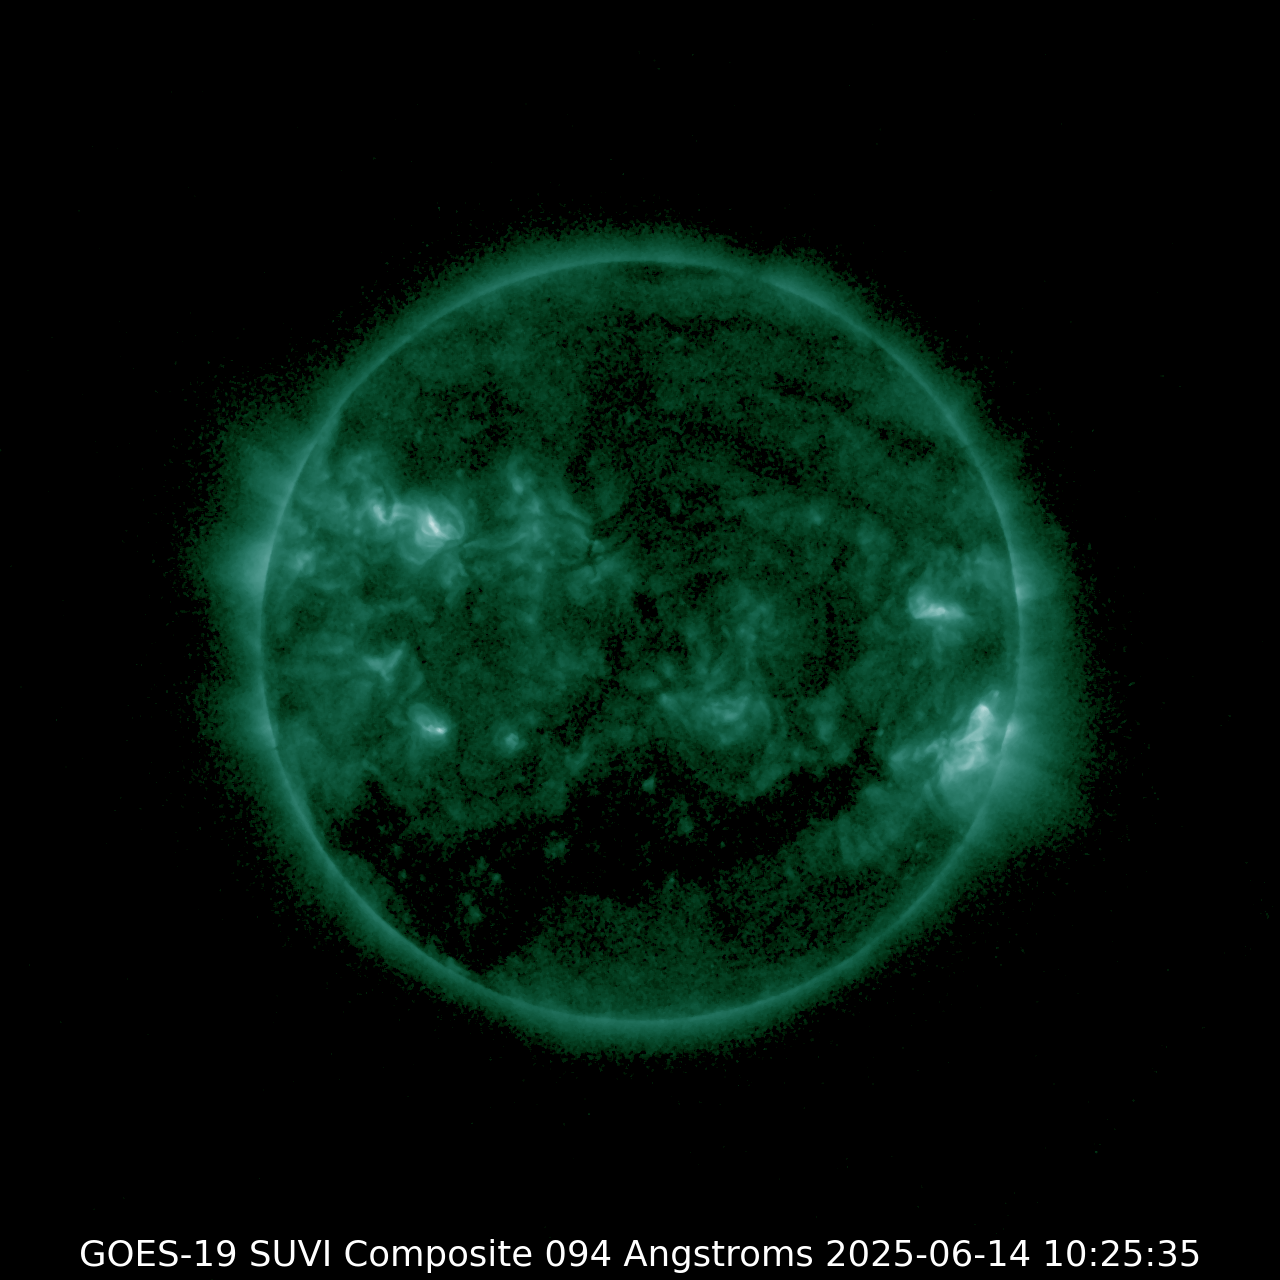
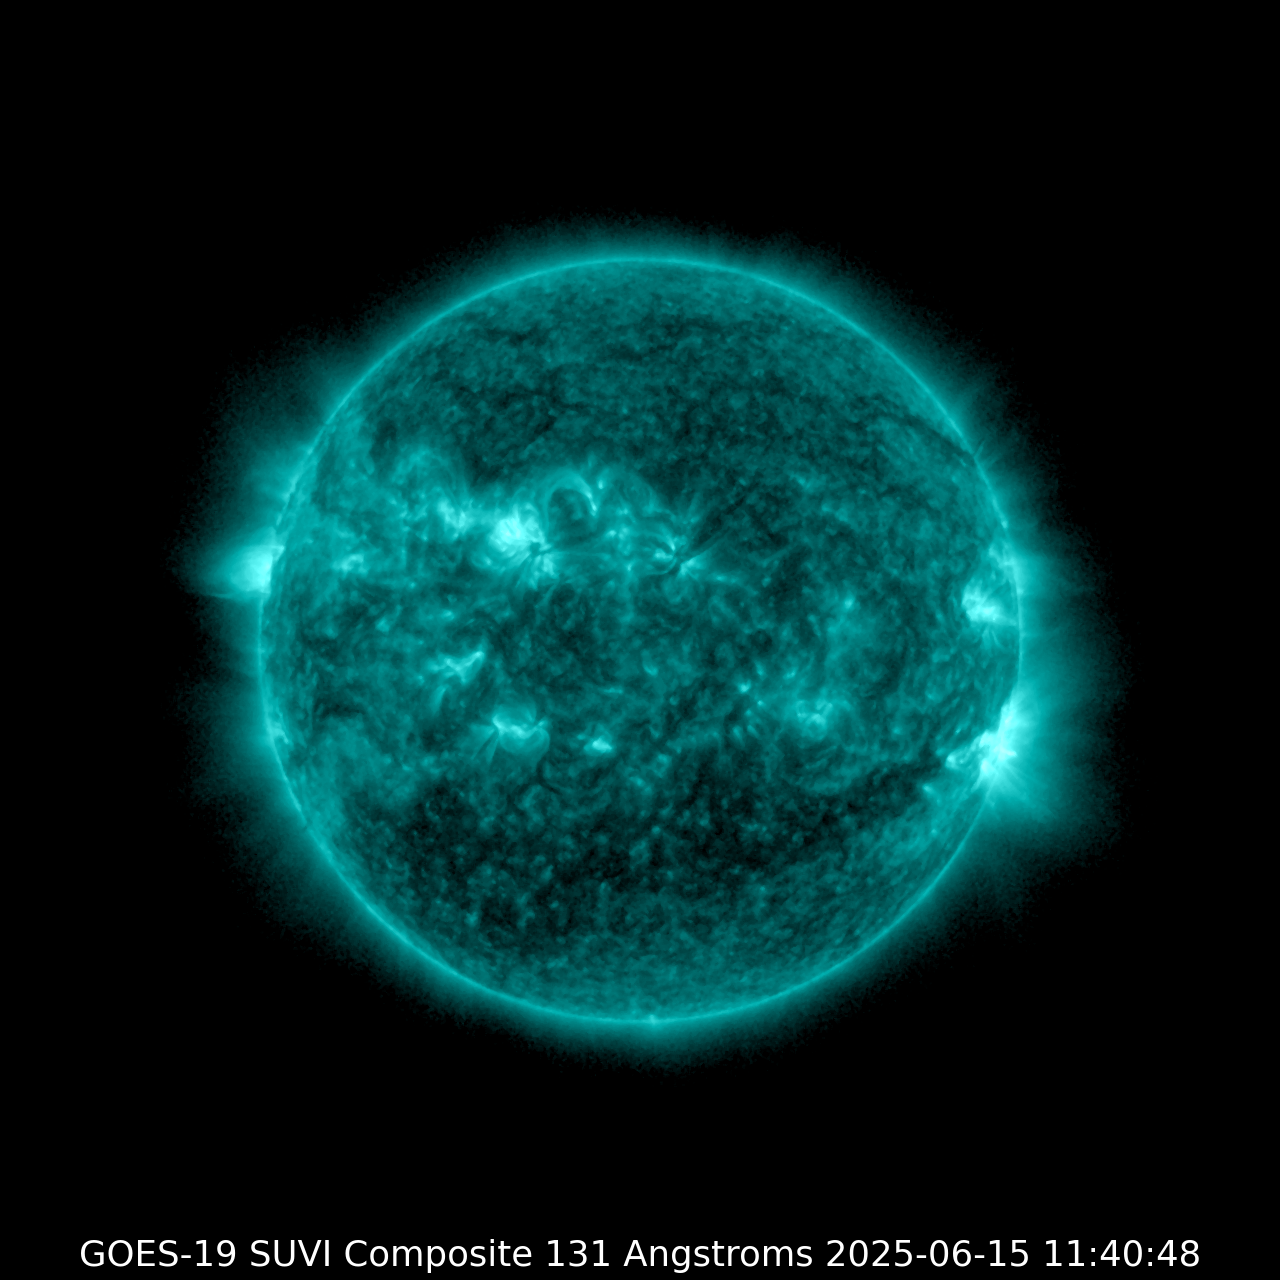
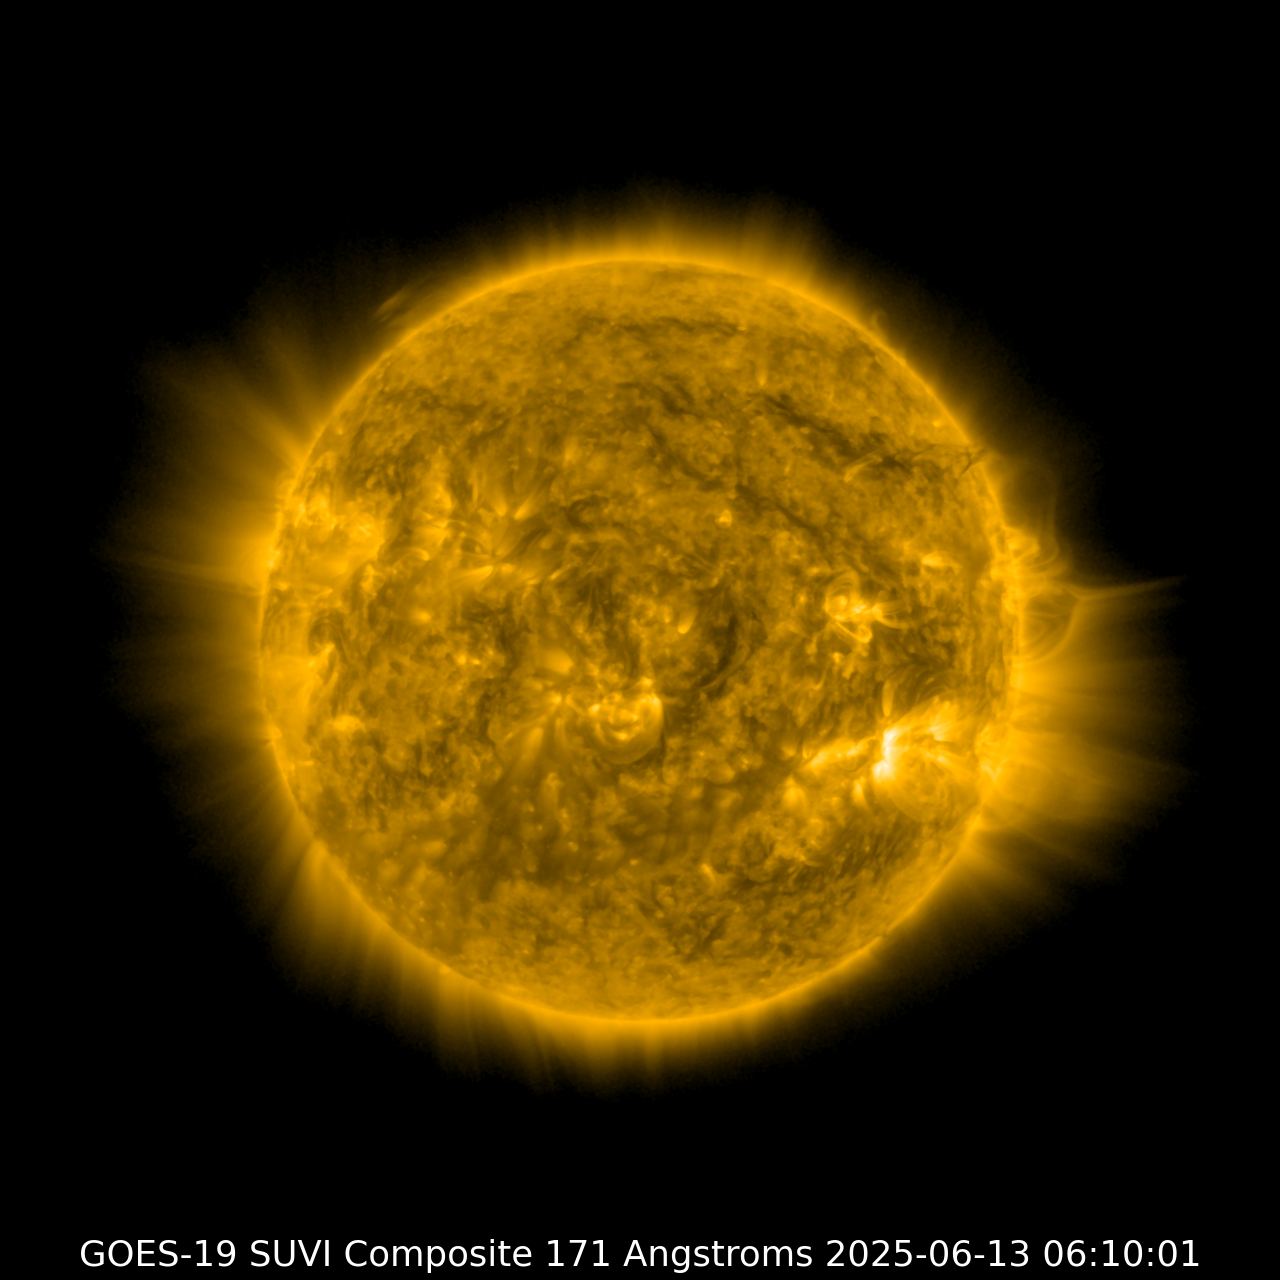
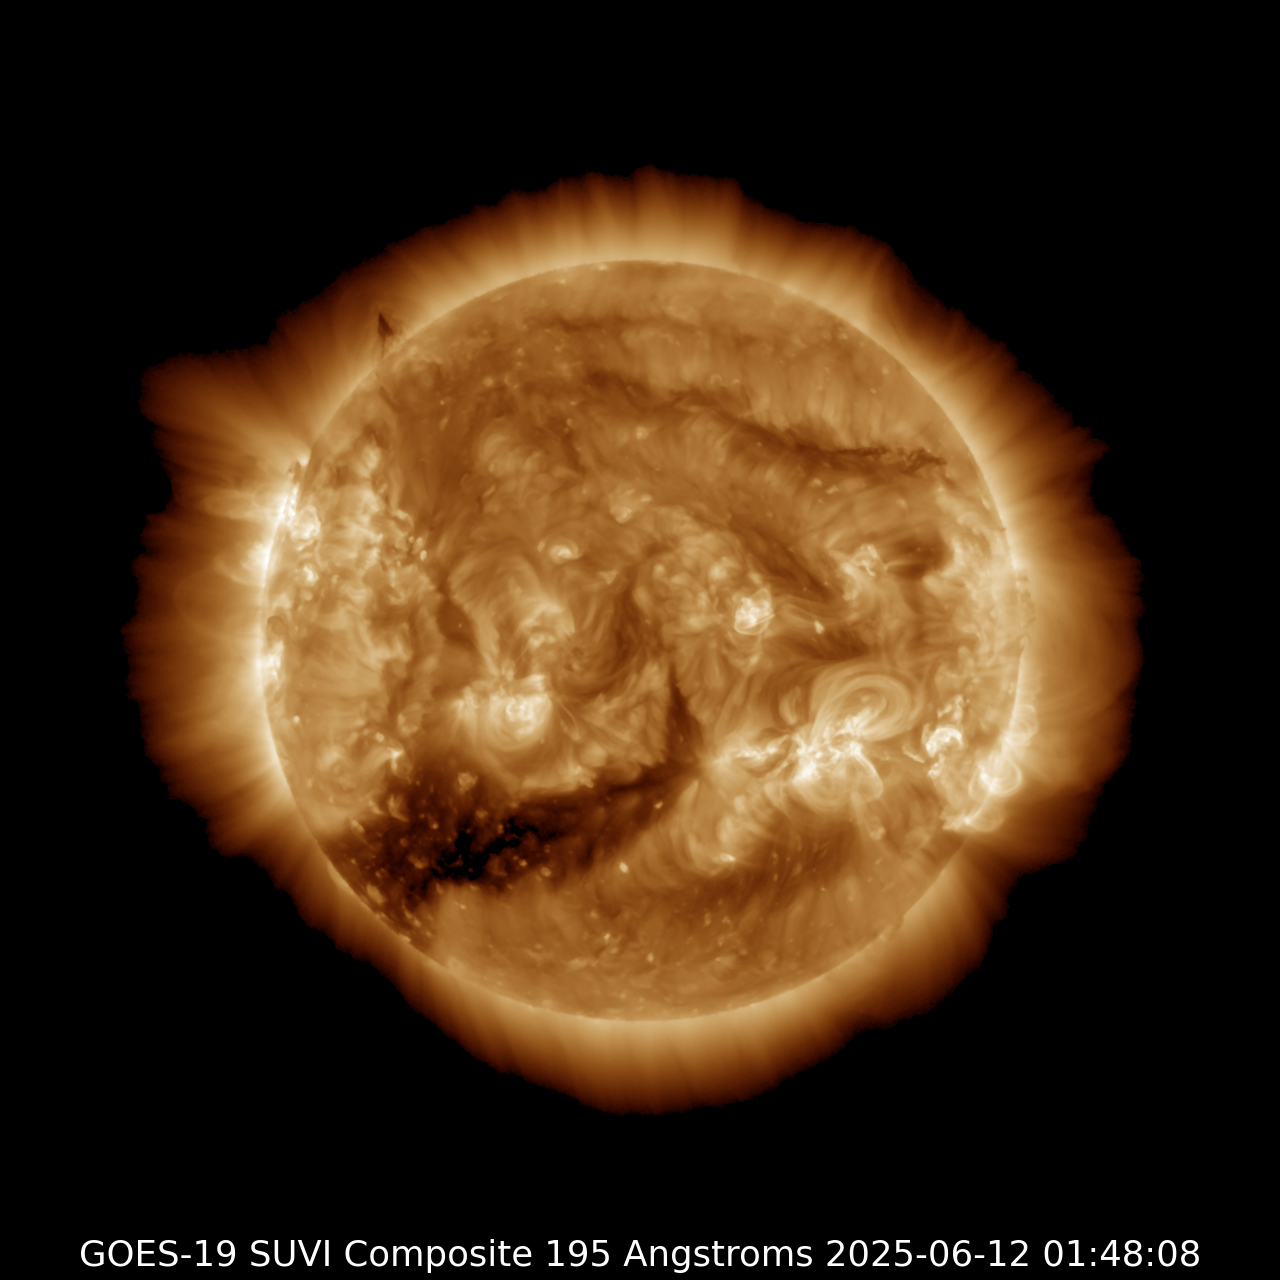
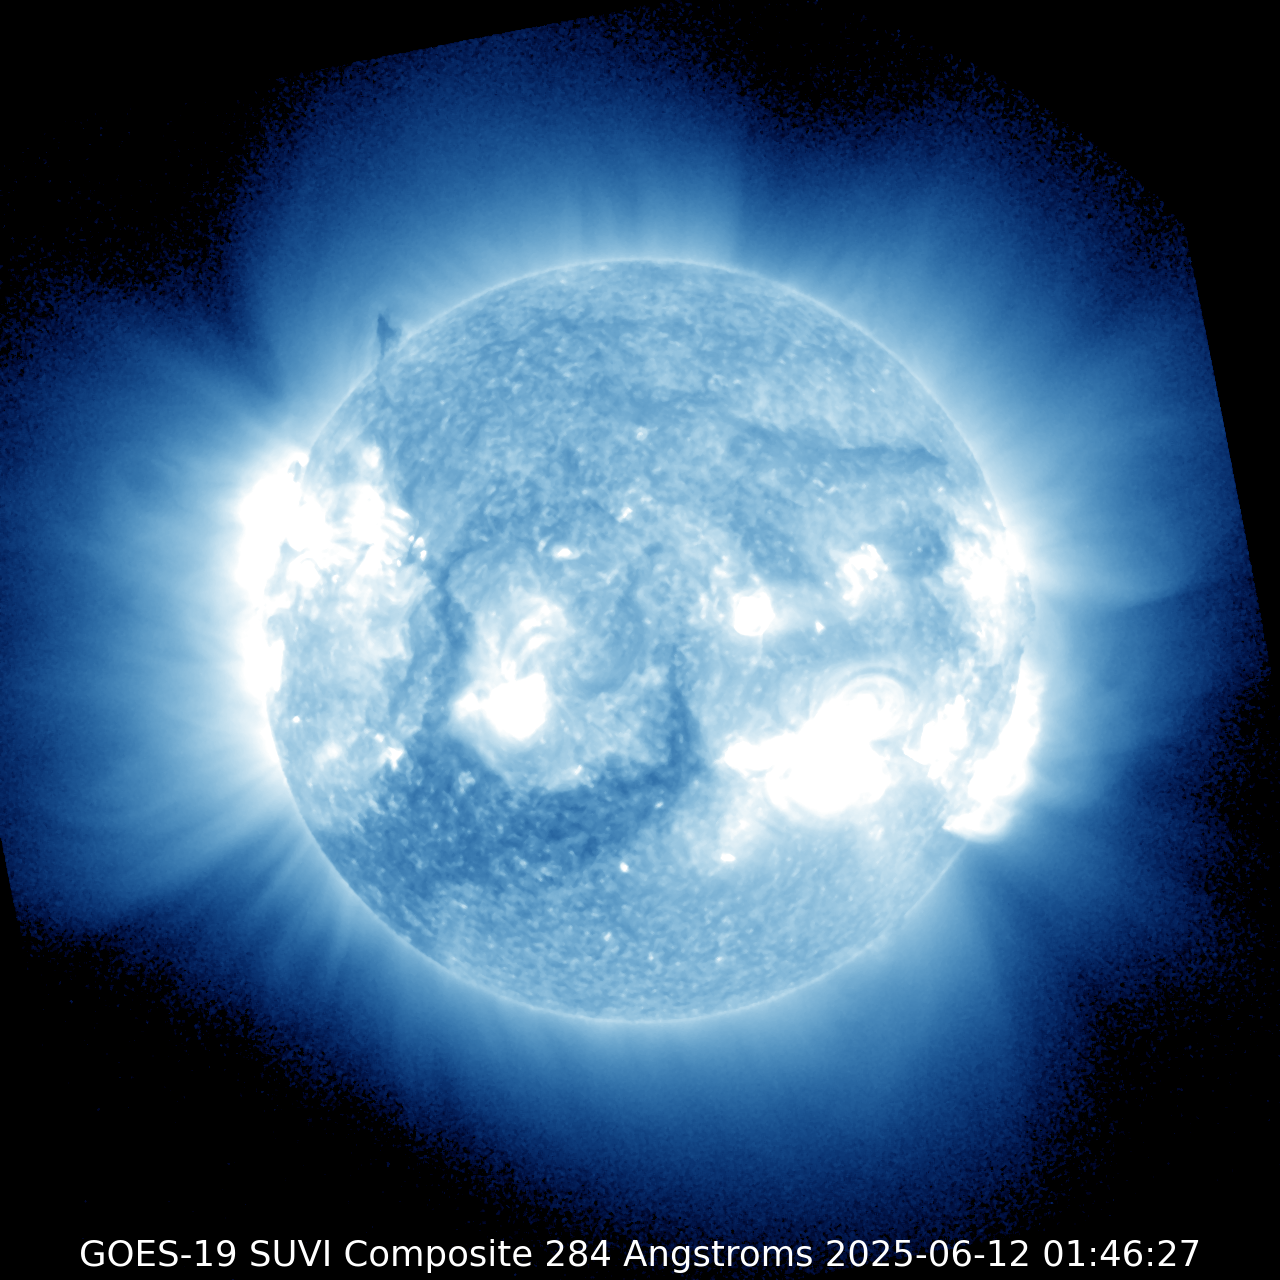
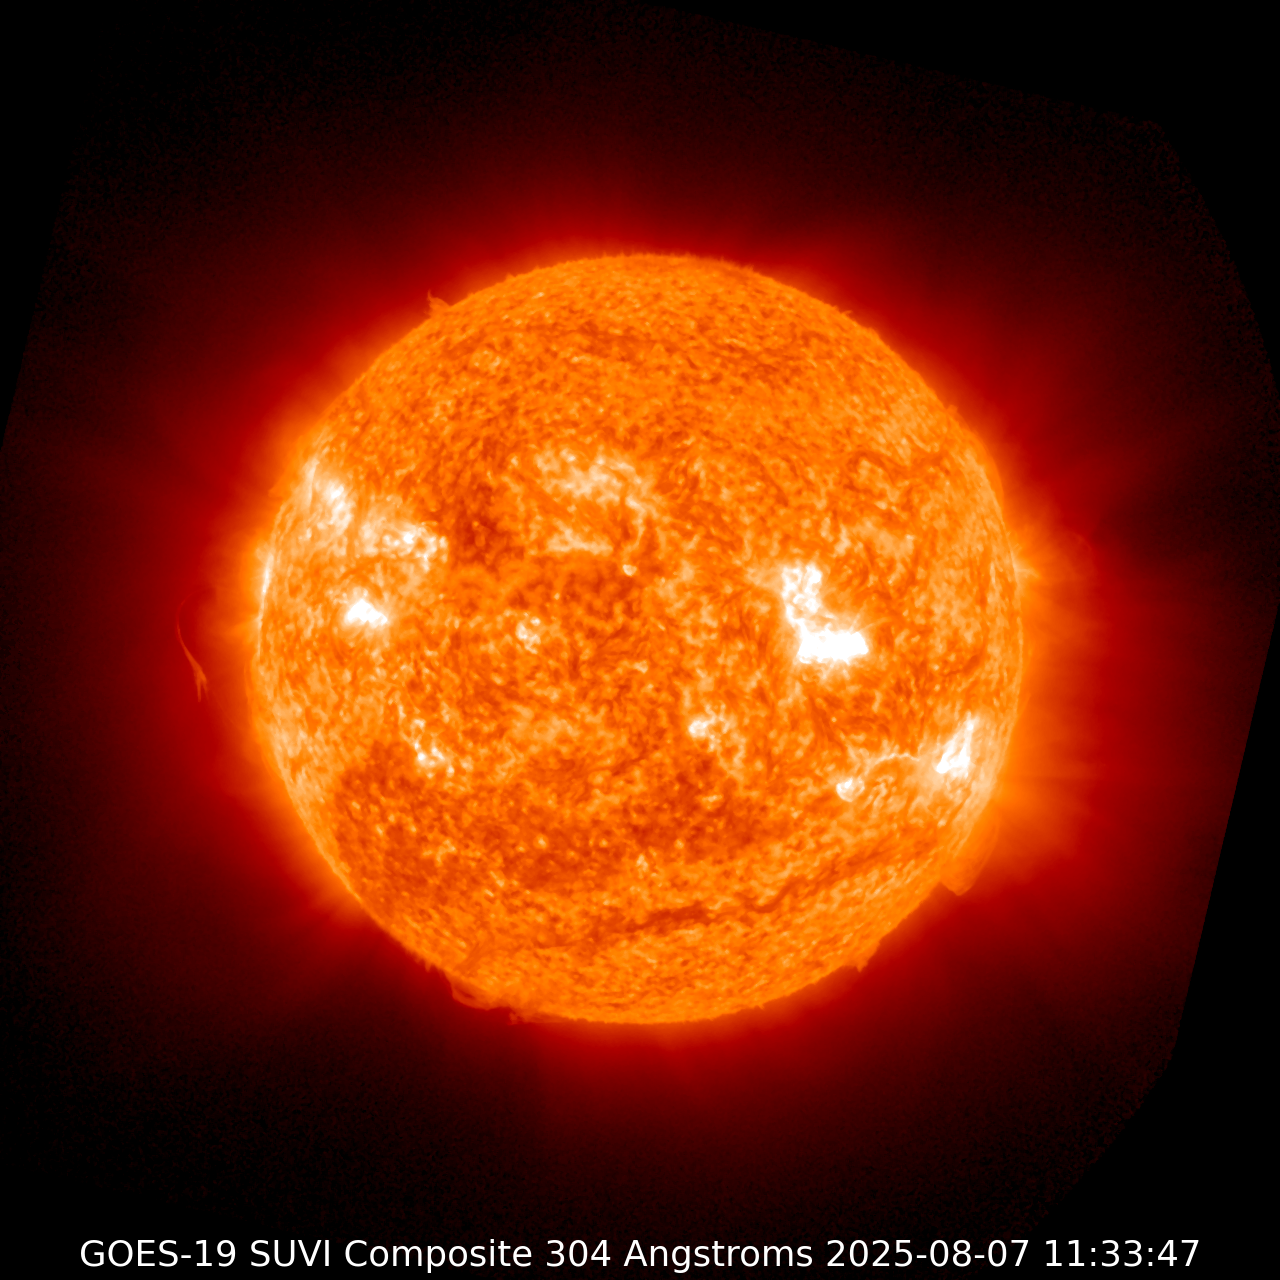
Each wavelength reveals unique features:
- 94 Å: Extremely hot flare plasma and intense solar flaring regions
- 131 Å: High-temperature plasma, solar flares, and active regions
- 171 Å: Detailed view of the lower corona and solar dynamics
- 195 Å: Hot corona and solar wind structures
- 284 Å: Intense solar corona activity
- 304 Å: Solar prominences and the solar corona
The Sun rotates in a fascinating way—its equator spins faster than its poles, taking about 25 days to complete a rotation at the equator and around 35 days near the poles. This differential rotation twists the Sun’s magnetic field, driving solar activity like sunspots and flares. Even over just a couple of days, we can see subtle shifts in sunspot positions, flares, and prominences—revealing the dynamic nature of our closest star. Check out the latest 48-hour rotation video and check for massive solar flares!
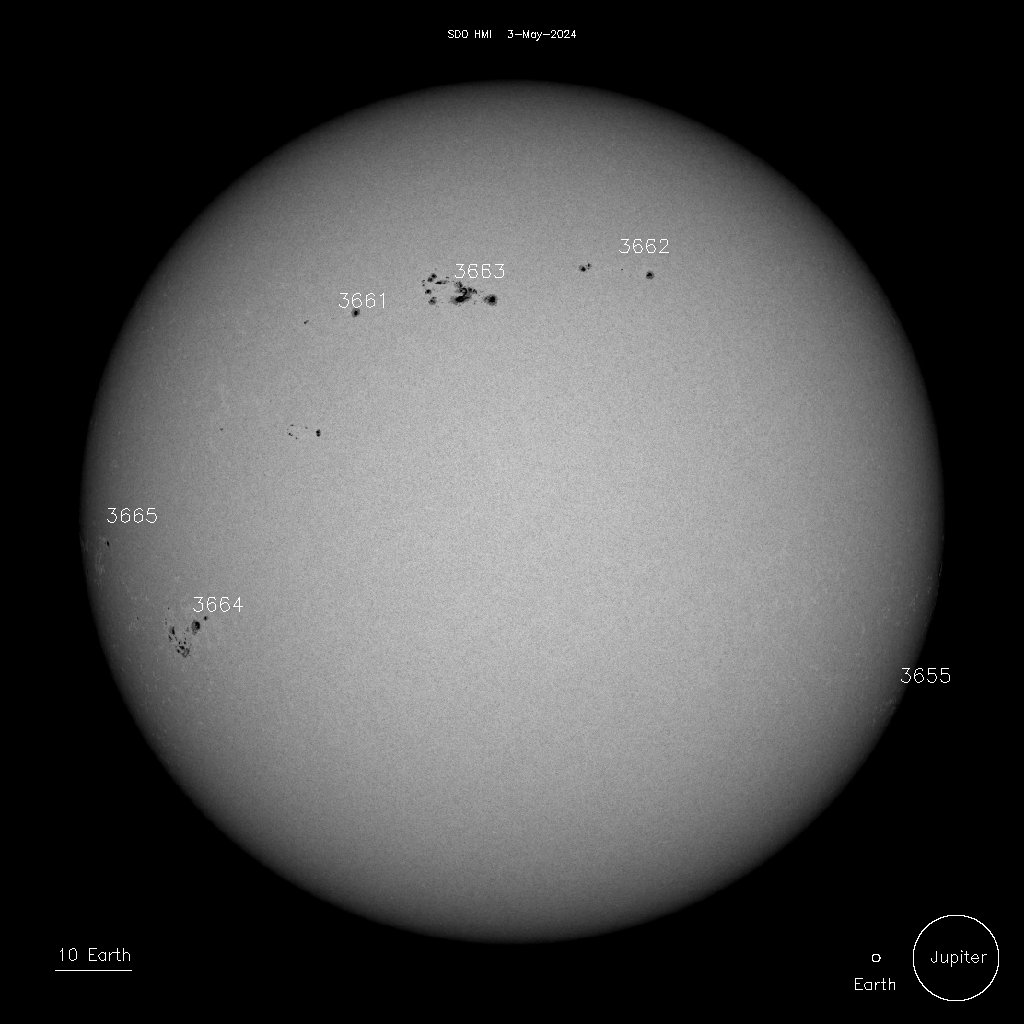
Latest Photosphere Image of the Sun
A sunspot is a dark, cooler region on the Sun’s surface caused by intense magnetic activity. These areas, often linked to solar flares and coronal mass ejections, can affect space weather, disrupting satellite communications, GPS, and power systems. For scale, Earth and Jupiter are shown at the bottom right of the image, highlighting the massive size of the Sun and its sunspots. Monitoring sunspots in real-time helps scientists track solar activity and improve space weather predictions.
Current Solar Activity Overview
Here’s an overview of current solar activities, including solar flares, limb features, coronal holes, prominences, filaments, and bright regions. Each of these phenomena represents different aspects of the Sun’s dynamic behavior.
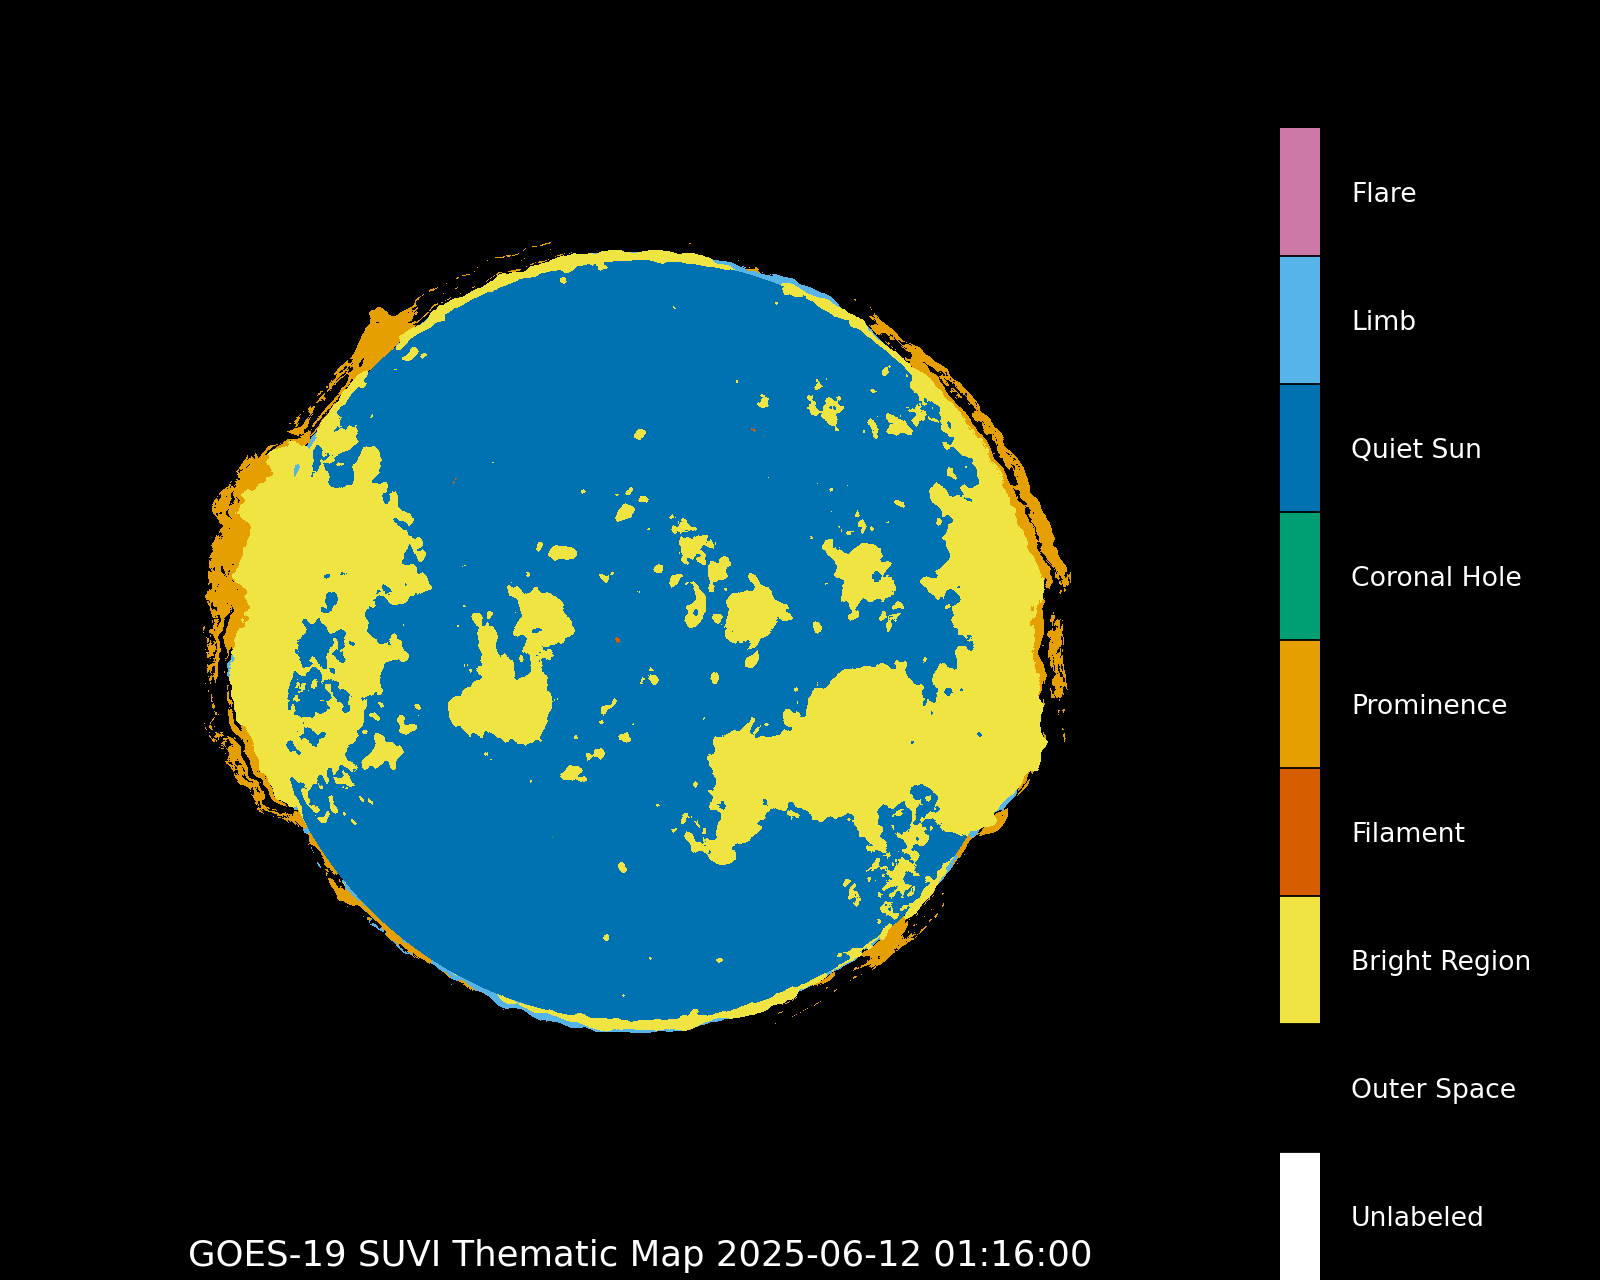
- Solar flares: Intense bursts of energy and radiation that can impact space weather.
- Limb: The edge or outer boundary of the Sun, where features like prominences are visible.
- Coronal holes: Areas on the Sun’s corona with lower density and temperature, often associated with high-speed solar wind.
- Prominences: Large, bright features extending outward from the Sun’s surface, often in a loop shape.
- Filaments: Dark, dense structures seen against the Sun’s brighter background, typically associated with magnetic activity.
- Bright regions: Areas on the Sun’s surface that are hotter and more active, often linked to sunspots or active regions.
Coronal Mass Ejections (CMEs)
These are the latest images tracking Coronal Mass Ejections (CMEs), massive bursts of solar wind, and magnetic fields released into space. The Sun is always shielded in these images by the GOES/Lasco instruments to block its brightness, allowing the dimmer corona and CMEs to be visible.
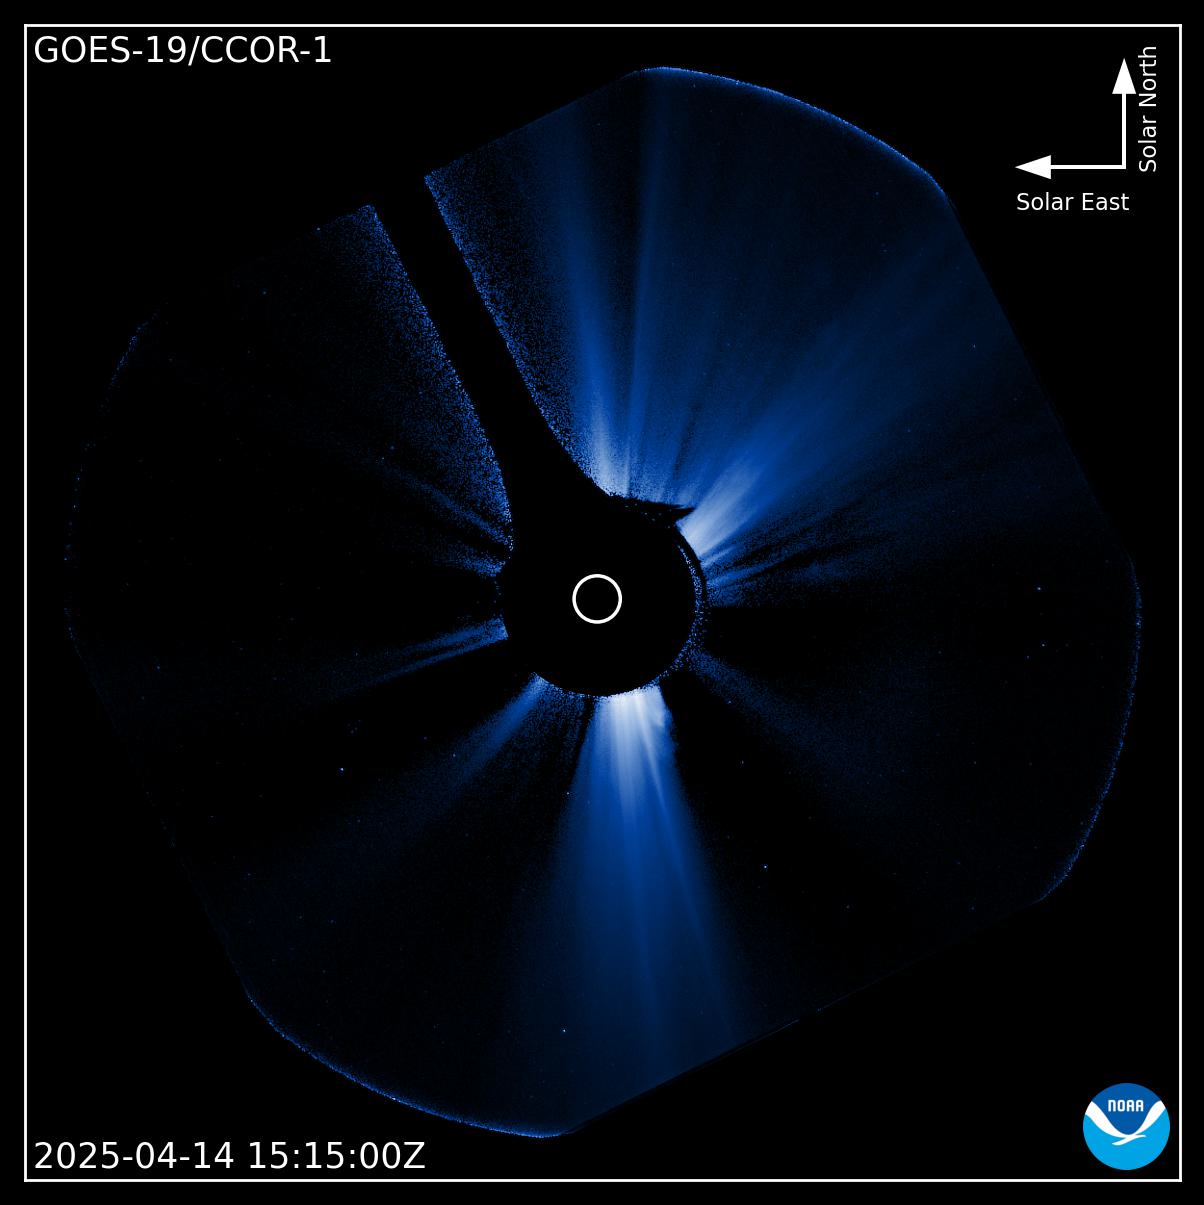
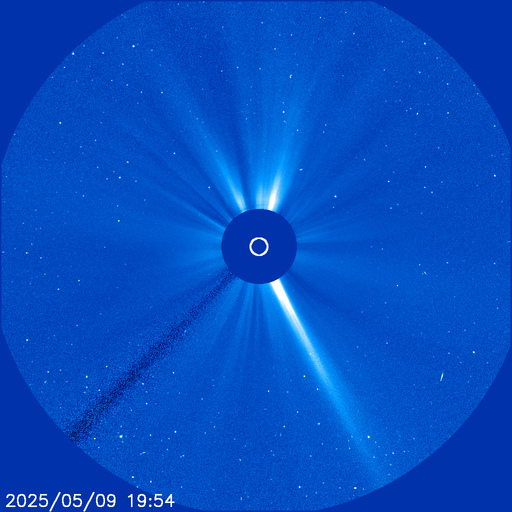
Don’t Just Watch the CMEs—Look for Comets Too!
While most eyes are on coronal mass ejections (CMEs) in LASCO timelapse videos, don’t miss the smaller, fast-moving objects—comets plunging toward the Sun. SOHO has discovered thousands of these sungrazing comets using its LASCO instruments. They often appear as bright streaks or dots darting into the Sun’s glare. These fleeting visitors offer a fascinating glimpse into the dynamic environment around our star, so keep an eye out for more than just solar eruptions!
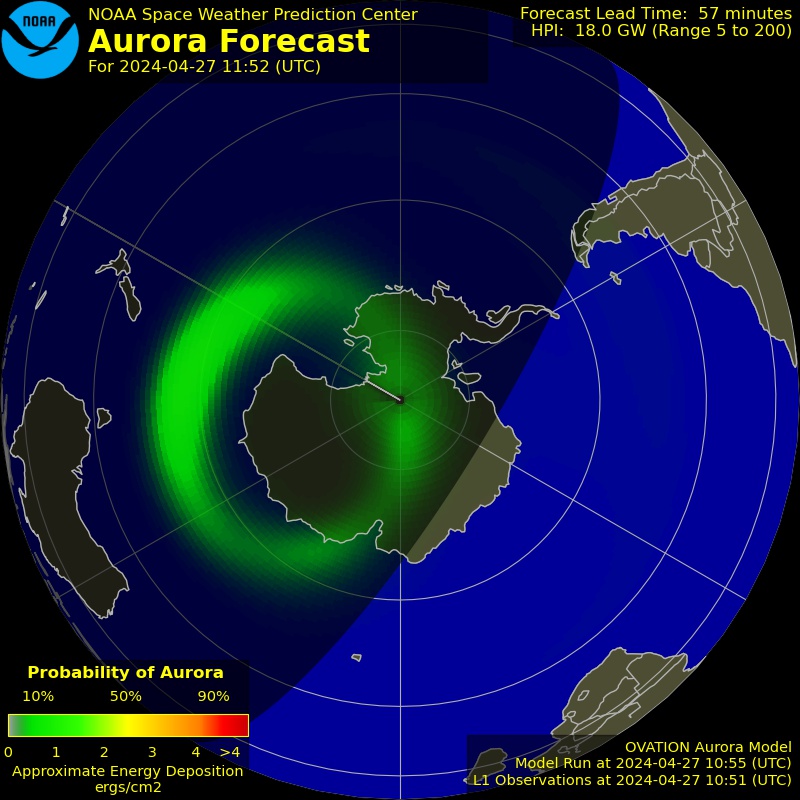
Aurora Forecast
These images display the current aurora forecast, based on solar wind conditions and geomagnetic activity. The yellow/red areas indicate a higher chance of aurora visibility in the northern and southern hemispheres. Auroras are beautiful light displays caused by solar particles interacting with Earth’s magnetic field, creating vibrant, flowing colors in the sky.

Solar Wind Activity
The following images present solar wind and geomagnetic activity data from the last 24 hours. Elevated solar wind speed and density can disturb Earth’s magnetosphere, enhancing geomagnetic activity and increasing the likelihood of auroras, sometimes making them visible at lower latitudes than usual.
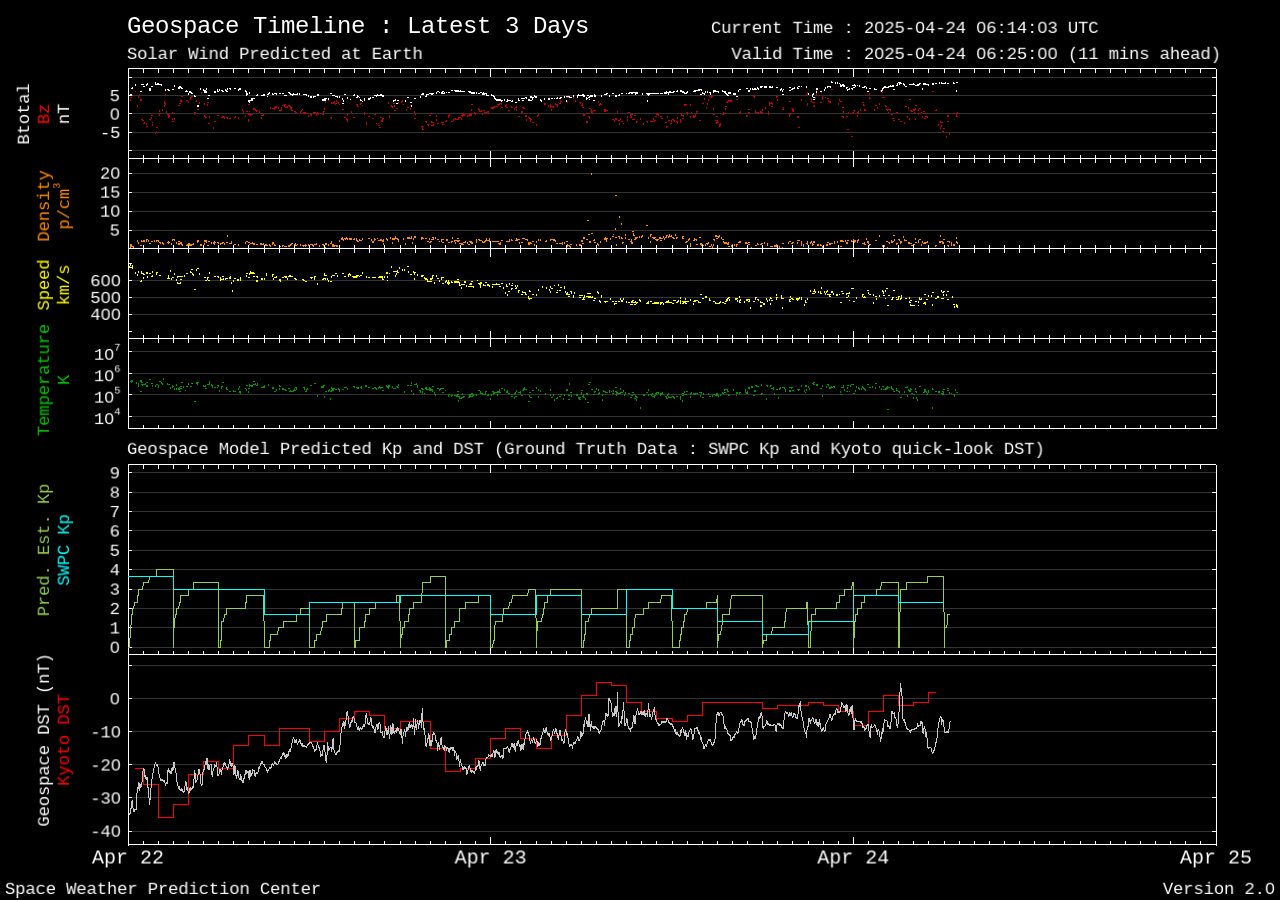
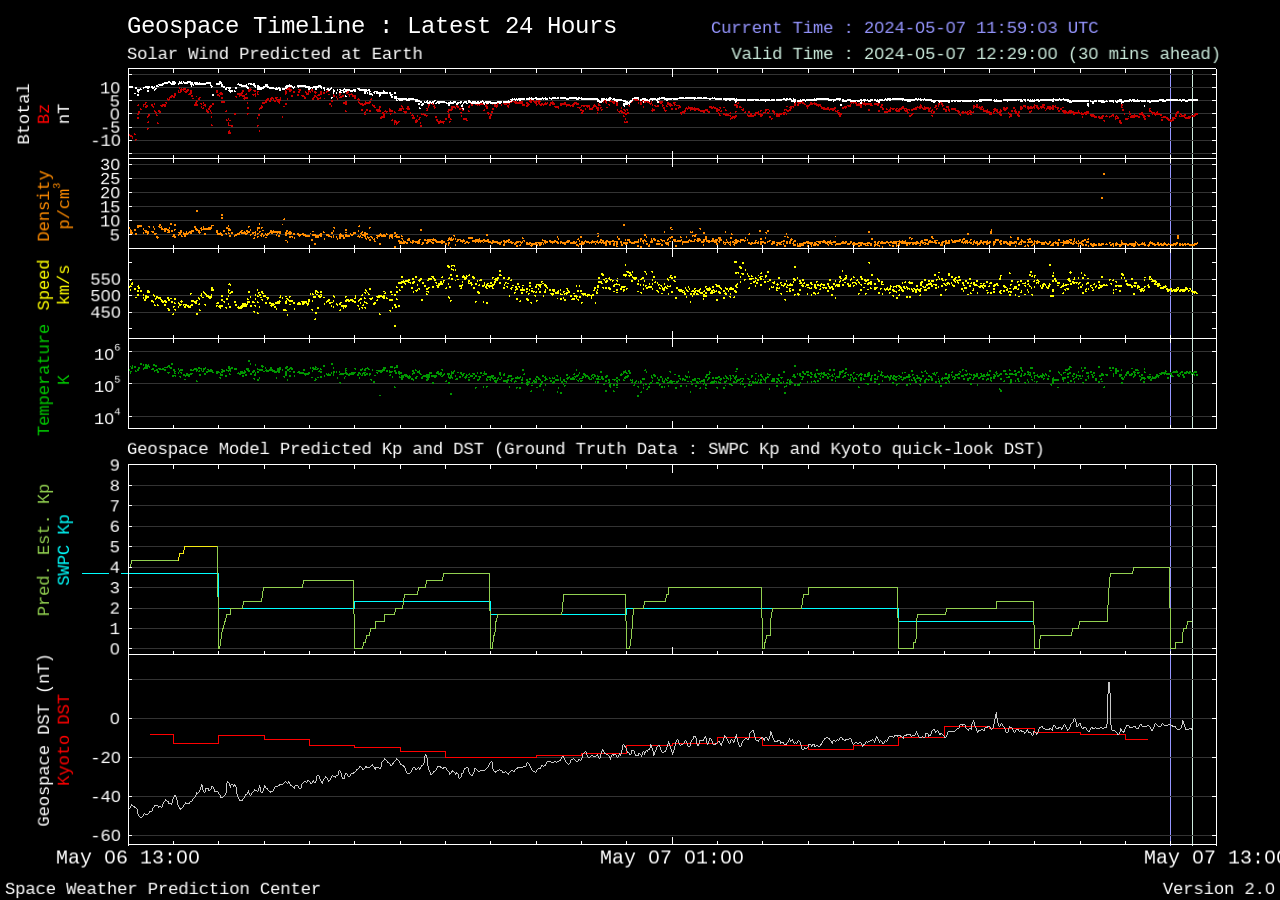
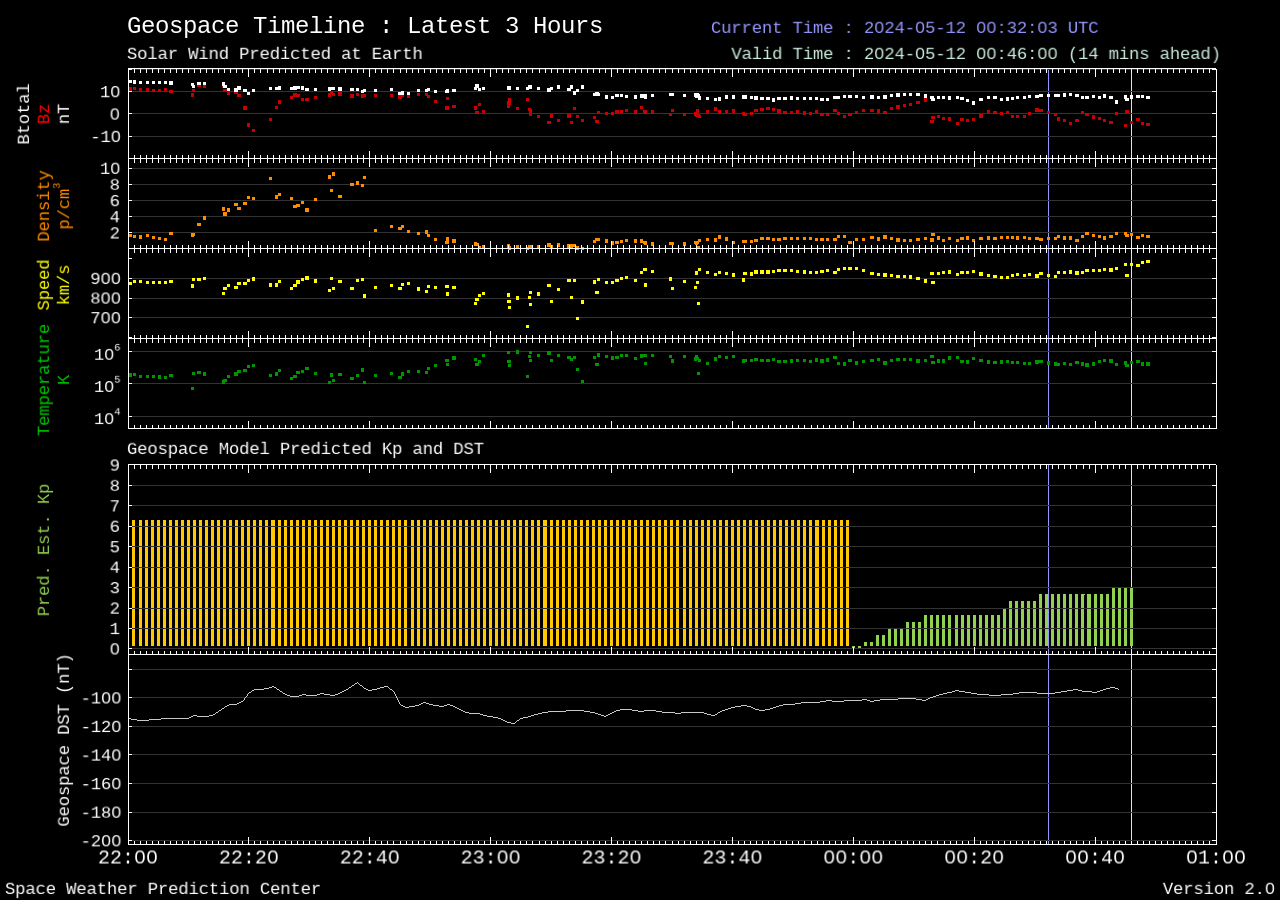
- BZ (NT): This tells us the direction of the solar wind’s magnetic field. When it points south (negative BZ), space weather effects, like geomagnetic storms, are stronger. If it points north (positive BZ), the effects tend to be calmer.
- Density (cm³): This measures how many particles (like protons and electrons) are packed into a specific area of space. A higher density means more particles.
- Speed (km/s): This measures how fast the solar wind and plasma particles are moving. Faster speeds can lead to more intense space weather.
- Temperature (K): This tells us how hot the plasma in space is. Hotter plasma means faster-moving particles, which can increase space weather activity.
- Predicted Estimated KP: This number (0 to 9) tells us how active Earth’s magnetic field is likely to be. A higher number means more intense space weather, like auroras or possible disruptions to communications.
- Geospace DST (NT): This measures the strength of Earth’s magnetic field during space storms. A lower value indicates a stronger storm.
These measurements help scientists predict when space weather will affect Earth, which is crucial for protecting satellites, communications, and power grids.
3-Day Solar Weather Forecast
Below is the most recent 3-Day Solar Weather Forecast as issued by the NOAA Space Weather Prediction Center. This report provides a comprehensive forecast of solar and geomagnetic activity, including solar radiation, geomagnetic storms, and radio blackouts. These events are critical for understanding space weather’s impact on communications, satellites, and Earth’s magnetic field.
List of upcoming Solar eclipses
| Year | Date | Type | Visibility / Notes |
|---|---|---|---|
| 2026 | August 12 | Total | Arctic, Greenland, Iceland, Spain |
| 2027 | February 6 | Annular | South America, southern Africa |
| 2027 | August 2 | Total | Northern Africa, Middle East |
| 2028 | January 26 | Annular | Australia, New Zealand, Antarctica |
| 2028 | July 22 | Total | Pacific, Australia, New Zealand |
| 2029 | January 14 | Partial | Arctic, Greenland, Northern Europe |
| 2029 | July 11 | Total | South America, Atlantic Ocean |
| 2030 | January 5 | Annular | North Africa, Middle East, India |
| 2030 | June 1 | Partial | Northern South America |
| 2031 | November 3 | Hybrid | Central Africa, Indian Ocean, Indonesia |
| 2030 | November 25 | Total | Antarctica, southern Atlantic Ocean |
| 2031 | May 21 | Annular | Northern Africa, Mediterranean, Middle East |
| 2031 | November 14 | Partial | South America |
| 2032 | May 9 | Total | North America |
| 2032 | November 3 | Partial | Europe, northern Africa |
| 2033 | April 28 | Annular | Pacific, North America |
| 2033 | October 22 | Total | Asia, Australia |
| 2034 | April 17 | Partial | South America, Antarctica |
| 2034 | October 10 | Annular | Africa, Europe |
Nice website. What might make it more interesting yet, is explaining the interactions of space weather and our own weather. How earths magnetic field works and the suns impact on it. How that creates what we see and feel on earth. You touch upon it with the Aurora report, Sun Spots, Solar Flares & CME’s, but what is truly interesting is the impact of that on earth and how it plays out. It’s a very interesting topic.
I agree
ESSENTIAL INFO-THANK YOU
Hi i do enjoy this its nice to all the spikes and inclines of the sun props to you all have a good day