Webb has met or exceeded every expectation since its December 25, 2021 launch! In April 2022, teams completed the initial alignment of Webb’s four powerful onboard science instruments, and each instrument began delivering crisp, well-focused images and clear data. For the next two months, science teams worked around the clock to test the capabilities of every instrument, fully vetting their optics, filters, detectors, as well as its imaging and spectroscopic observing modes. The public unveiling began the evening of Monday, July 11, when President Joe Biden showed Webb’s first image, the deepest and sharpest infrared image of the distant universe at that time. So, what did Webb see in its first year? To grasp the significance of the discoveries made by the James Webb space telescope, it is crucial to first understand its primary purpose, which is to observe infrared light, and the immense value this holds.
Credit: NASA, ESA, CSA, and STScI
Why study infrared light?
The rainbow of light that the human eye can see is a small portion of the total range of light, known in science as the electromagnetic spectrum. Telescopes can be engineered to detect light outside the visible range to show us otherwise hidden regions of space. Webb detects near-infrared and mid-infrared wavelengths, the light beyond the red end of the visible spectrum.
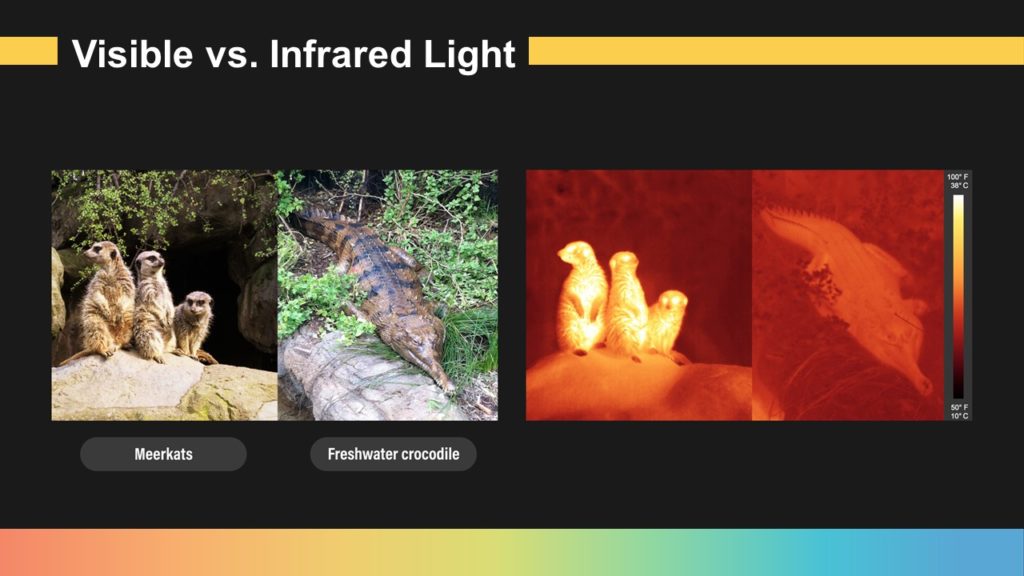
Let’s look at this concept with more familiar objects. Visible light provides us with detailed information about our environment, including colors and textures, as seen with these meerkats and freshwater crocodiles (a Tomistoma). In infrared light, we see different details. The meerkats glow dramatically. Their high metabolisms cause them to glow brightly in the infrared through insulating layers of fur. The freshwater crocodile is faintly brighter than the cool ground, which tells us it had recently been lounging in a nearby pool of warm water. It’s been out of the water long enough to start to cool down. Infrared is a type of light our eyes can’t see. It’s redder than red light. Everything is glowing, even if we can’t see it with our eyes. Many things, like computers, humans, and animals, glow in infrared light.
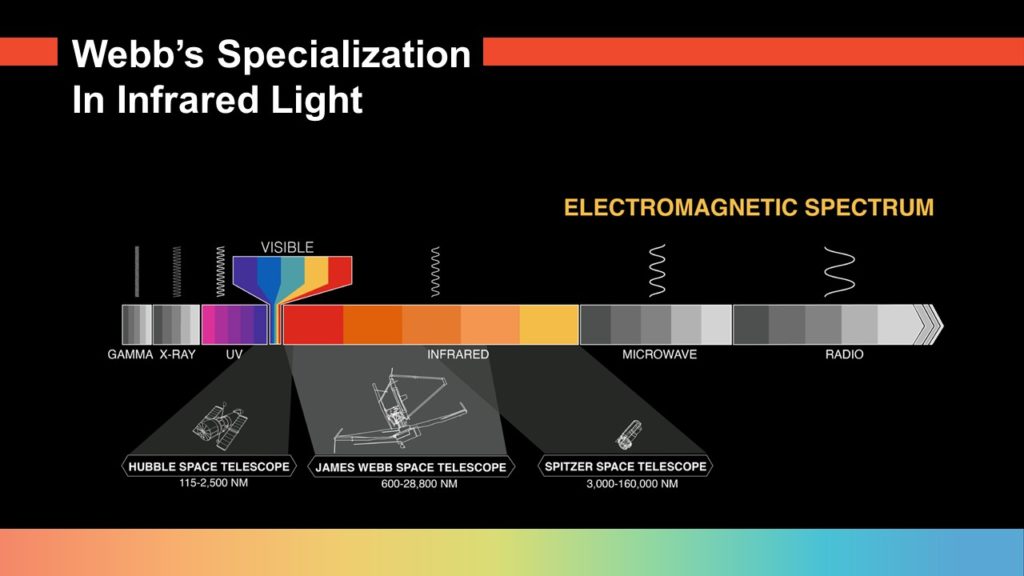
Let’s look at the electromagnetic spectrum in detail. All electromagnetic radiation is a form of light. The portion of light labeled “visible,” with the colors of the rainbow, is what humans can see. Beyond the red end of the visible spectrum, the wavelengths are longer than the human eye can detect. This portion of the spectrum is called infrared. Longer wavelengths, including infrared light, are able to pass through areas of dense gas clouds and other matter in the universe. Shorter wavelengths get trapped, which means telescopes that specialize in visible light can’t capture them. By detecting longer infrared wavelengths of light with Webb, we can now see cool stars and warm planets clearly.
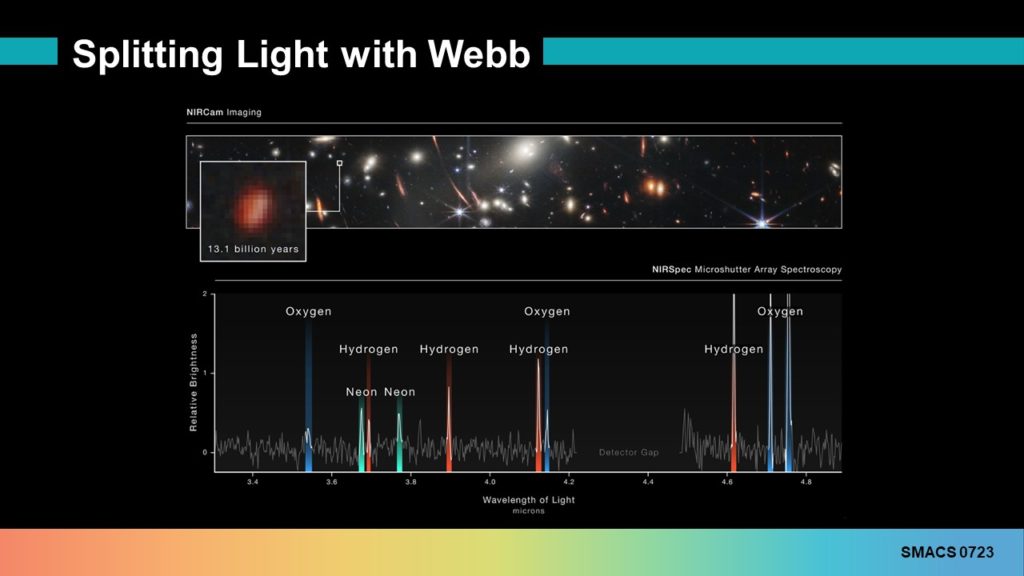
In addition to taking images, Webb also returns highly detailed data known as spectra. Spectra spread out the light from objects near and far, like the distant galaxy shown above, so researchers can reveal what’s in them! All molecules and elements leave specific signatures in the light, so researchers begin by looking for these well-known patterns. Webb’s near-infrared spectrum, the graph shown here, has tall peaks. These are emission features caused when specific wavelengths of light are emitted by gases like oxygen, hydrogen, and neon. You don’t need to understand this particular graph in detail! This picture is designed to demonstrate that spectra are responsible for some of the most intriguing headlines in astronomy. They provide an incredible amount of detailed information. For example, spectra also teach us about the composition, temperature, density, and movement of objects in space, like planets, stars, and galaxies.
Webb’s first year of science: What did it see?
It’s only been one year since the James Webb Space Telescope’s first full-color images and data were released! What has Webb shown us? Let’s take a tour together!
New views of the Planets in our Solar System
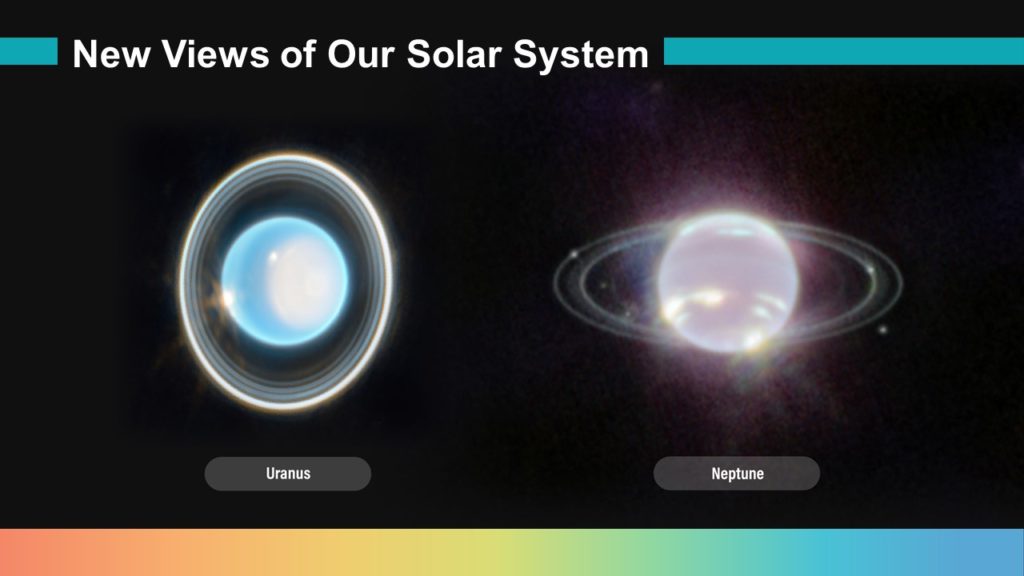
Uranus and Neptune look very different from what you might be used to seeing! Why? Webb observes infrared light, which lies beyond what our eyes can detect. Let’s switch to a more familiar view to compare Webb’s images.
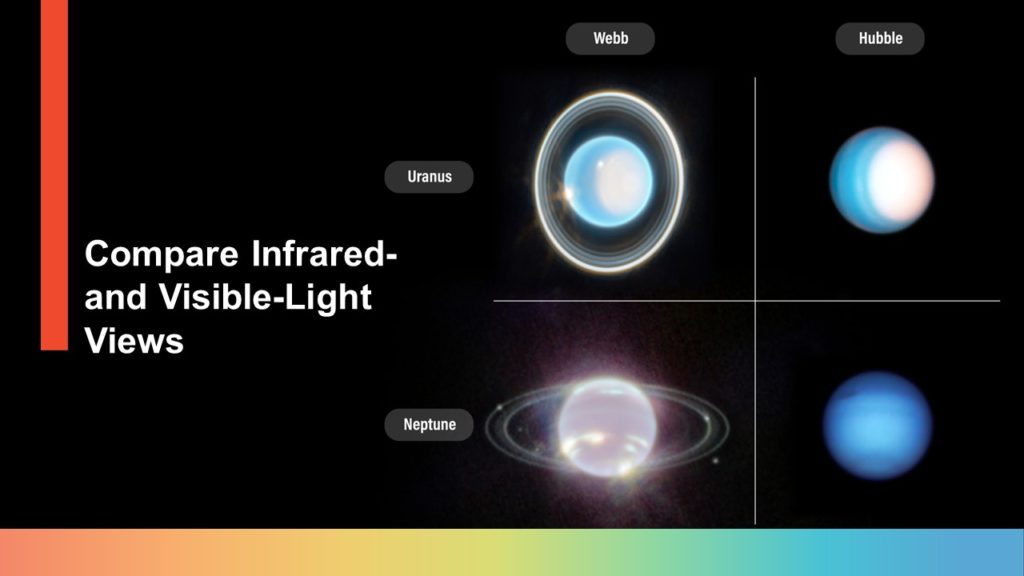
Ah! Now these planets might look more familiar. Two views are shown of each planet. Uranus is shown in the top row, with Webb’s image at left and Hubble’s at right. Neptune is on the bottom row, with Webb’s view at left. Infrared light from Webb shows us the rings of both planets! Now, let’s look at Neptune in its “corner” of the Solar System.
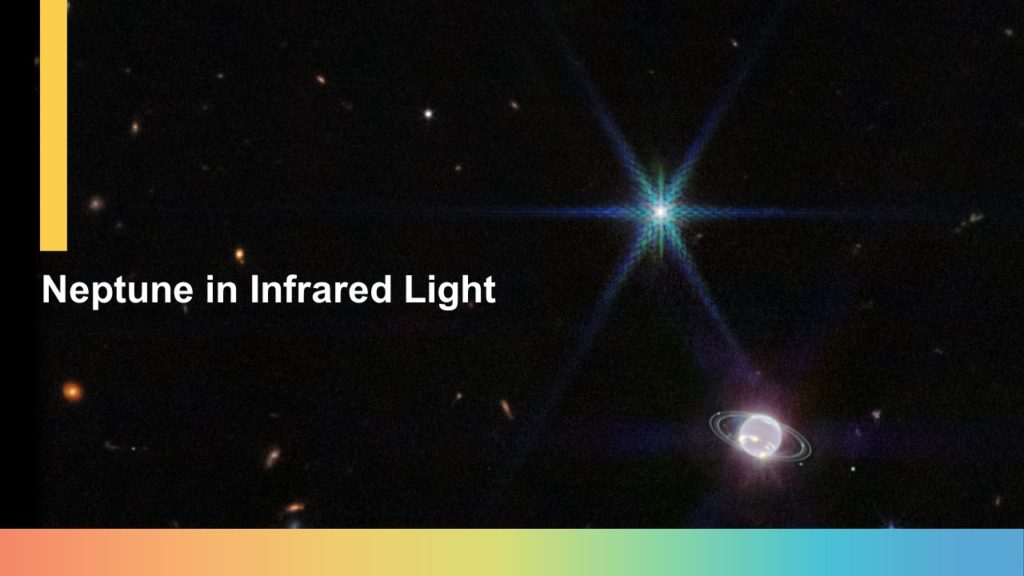
Webb captured the clearest view of Neptune’s rings in more than 30 years with its first image of the ice giant. Some of the planet’s rings haven’t been detected since NASA’s Voyager 2 flew by in 1989. And, with Webb, we see more: Its infrared light observations detected faint rings very close to the planet. Webb’s image also clearly shows Neptune’s fainter dust bands, another first in infrared light. A thin line of brightness circling the planet’s equator could be a result of the circulating atmosphere that powers Neptune’s winds and storms. The atmosphere descends and warms at the equator and, as a result, glows at infrared wavelengths more than the surrounding, cooler gases. Webb also captured seven of Neptune’s 14 known moons. I’d like to point out one in particular. Just above and to the left of Neptune is a very bright point of blue light—but this is not a star. It is the large moon Triton. Covered in a frozen sheen of condensed nitrogen, Triton reflects an average of 70 percent of the sunlight that hits it. It also far outshines Neptune in this image because the planet’s atmosphere is darkened by methane absorption at these near-infrared wavelengths, except where high-altitude clouds are present.

Jupiter also looks a bit different in near-infrared light! With Webb, we can see Jupiter’s giant storms, powerful winds, and auroras. Jupiter’s Great Red Spot, a famous storm so big it could swallow our entire planet, appears white. Other clouds that dot the planet also appear white. That’s because they are all reflecting a lot of infrared sunlight. Hazes swirling around its northern and southern poles appear in yellow and green. Blues showcase shorter infrared light that is reflected from a deeper main cloud. Auroras, which shine in red, extend to high altitudes above both its northern and southern poles. Here’s a fact that may wow you: The planet’s rings are a million times fainter than the planet itself.
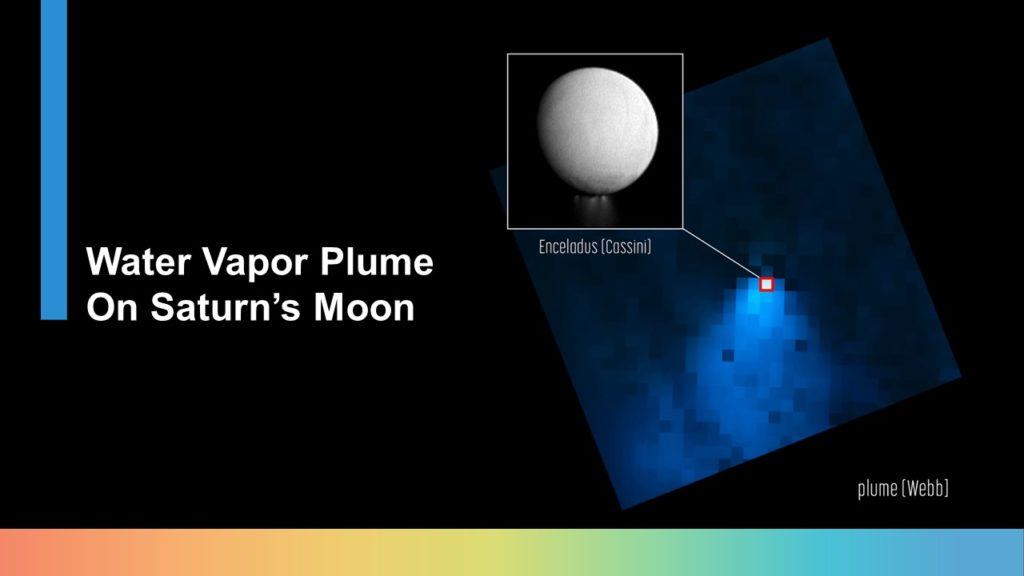
Let’s take a look at Webb’s recent observations of Enceladus, one of Saturn’s moons. Enceladus is an ocean world, but it’s only four percent the size of Earth and just 314 miles across. In the graphics, is a close-up from NASA’s Cassini orbiter. Webb’s image is at center. The moon Enceladus is the single white box outlined in red. Enceladus is very interesting to researchers because a global reservoir of salty water is sandwiched between the moon’s icy outer crust and its rocky core. And its geyser-like volcanos spew jets of ice particles, water vapor, and organic chemicals out of crevices on its surface.
Webb detected a shockingly large water vapor plume that spans more than 6,000 miles. That’s the brighter blue region below the moon in the Webb image. It takes up a lot of space because it’s big! It would take up about the distance from Los Angeles, California, to Buenos Aires, Argentina. The length of the plume was not the only characteristic that intrigued researchers. Water is gushing out at 79 gallons per second. As Enceladus whips around Saturn every 33 hours, the moon and its jets are basically spitting off water, leaving a halo, almost like a belt, in its wake. Not only does Webb show the plume is huge, the telescope’s observations directly demonstrate how the moon’s water vapor plumes feed the “belt” of water. Astronomers have determined roughly 30 percent of the water stays within this “belt,” and the other 70 percent escapes to supply the rest of the Saturnian system of water.
Webb is also giving scientists a direct look for the first time at how the moon’s water jets gush from the surface of the moon and feed into the entire system of Saturn, including its rings. Researchers will continue to use Webb to monitor this plume to learn where the water goes. It’s water in our solar system—so it’s worth watching!
Webb Captures Exoplanets in search for signs of life
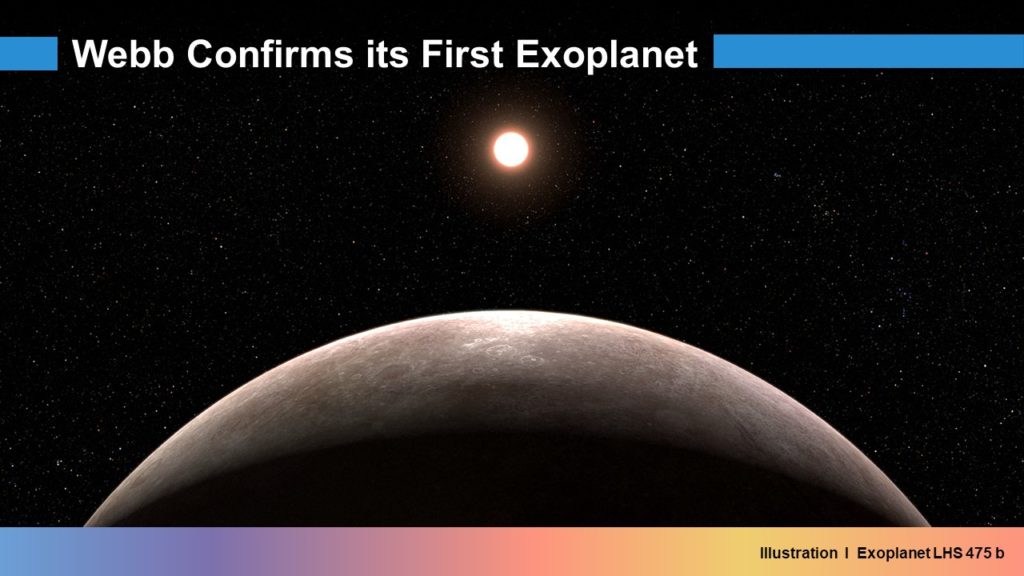
Telescopes often work together to identify new planets. One mission, NASA’s Transiting Exoplanet Survey Satellite (or TESS), regularly surveys the entire sky to help researchers identify potential planets. Researchers using Webb followed up on a lead from TESS. Webb confirmed that exoplanet LHS 475 b is, in fact, a planet and that it is 99 percent Earth’s size. This is Webb’s first confirmation of a planet—and many more will roll in as the months go by. The illustration shows what LHS 475 b is like. This rocky exoplanet orbits a red dwarf star roughly 41 light-years away, but it whips around its star in only two Earth-days. Our Milky Way galaxy is filled with planets that are waiting to be detected and then fully explored! Which types of planets might Webb examine next? It’s important to know that Webb will often study planets around red dwarf stars, because they are easier to study. These stars are smaller and their planets block a larger portion of their stars’ light. They are also the most common stars in our galaxy. These stars have very active early lives. Can the planets around them hold onto an atmosphere at all? In the meantime, let’s take a look at a few other planets Webb has already observed!
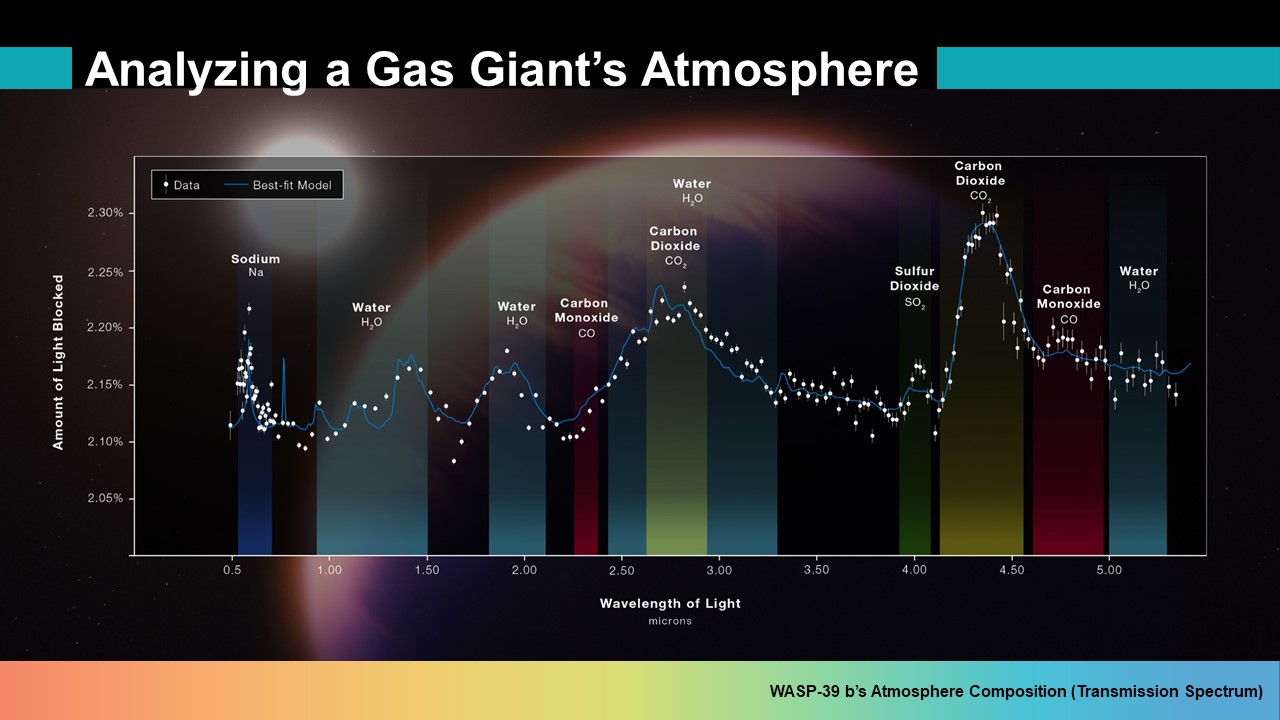
Webb detailed atoms, molecules, and even signs of active chemistry and clouds on exoplanet WASP-39 b! First, some context: This planet is classified as a “hot-Saturn,” which means it is a gas giant planet. It is about as massive as Saturn, but in an orbit tighter than Mercury’s. Webb captured the first clear evidence for carbon dioxide in the atmosphere of a planet outside our solar system on WASP-39 b. Understanding the composition of a planet’s atmosphere is important because it tells us something about the origin of the planet and how it evolved. Webb also made a slew of additional detections! The telescope made the first detection of sulfur dioxide in an exoplanet atmosphere. Webb also detected sodium and water vapor. WASP-39 b’s extensive chemical inventory suggests a history of smashups and mergers of smaller bodies that created an eventual goliath of a planet. Webb’s data also indicate that oxygen is a lot more abundant than carbon in this planet’s atmosphere. This potentially indicates that WASP-39 b originally formed far away from its star.
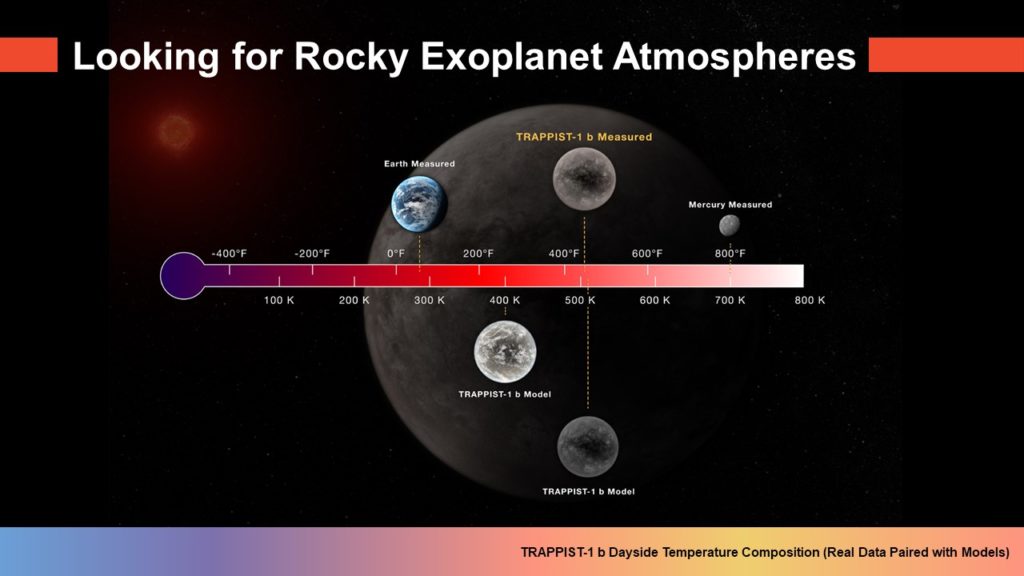
Seven Earth-size planets orbit the star TRAPPIST-1, a cool red dwarf star that is 40 light-years from Earth. Webb will observe all seven planets in the TRAPPIST-1 system. First up: The planet that is closest to the star, known as TRAPPIST-1 b. What did Webb find? With a dayside temperature of 450 degrees Fahrenheit, the planet is just about perfect for baking pizza, but with no atmosphere to speak of, it may not be the best spot to dine out. The graphic shows a comparison of the dayside temperature of TRAPPIST-1 b: Webb’s measurements compared to two computer models. The models take into account the known properties of the system, including the temperature of the star and the planet’s orbital distance. Both models were very close, but one was almost spot-on!
Although TRAPPIST-1 b is hot by Earth standards, it is cooler than the dayside of Mercury, which consists of bare rock and no significant atmosphere. Mercury receives about 1.6 times more energy from the Sun than TRAPPIST-1 b does from its star. TRAPPIST-1 b is different from Mercury in another way: It is tidally locked, which means one side faces the star at all times and the other is in permanent darkness. Webb’s observations of TRAPPIST-1 b are the first detections of any form of light emitted by an exoplanet as small and as cool as the rocky planets in our own solar system—making these results very exciting!
These observations also mark an important step in determining whether planets orbiting tiny but active red dwarfs, the most common type of star in our Milky Way galaxy, can sustain atmospheres needed to support life. Although the answer appears to be “no” for TRAPPIST-1 b, there are many more planets like it to explore elsewhere throughout our galaxy!
Webb captures Objects in our Galaxy

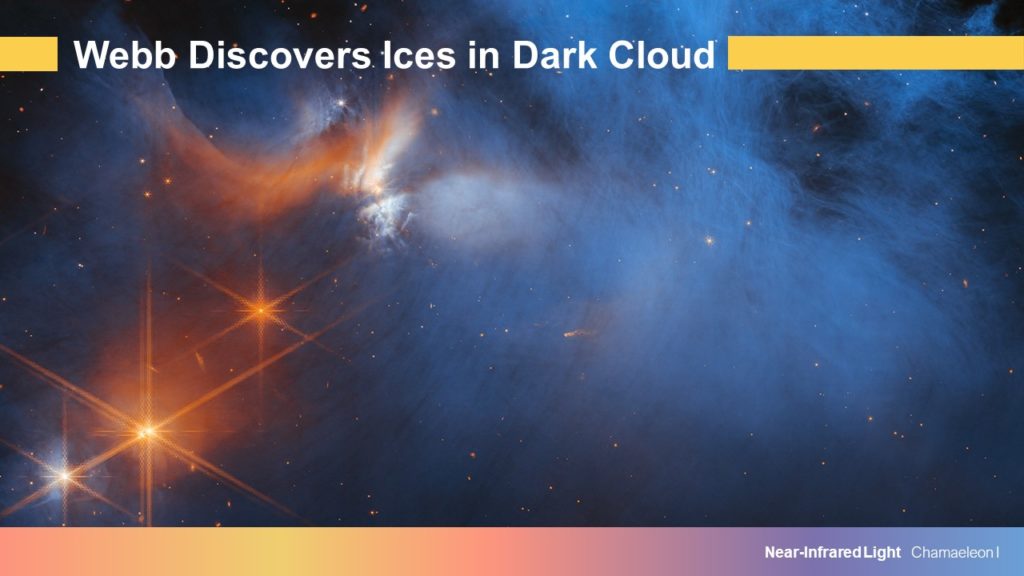
There’s A LOT to see in our Milky Way galaxy! This is only one example. What are we looking at? Webb revealed previously unseen features of a still-forming star, known as a protostar, within a dark cloud. The protostar itself is hidden from view within the skinny center of this hourglass shape. As material shoots away from the protostar, it collides with surrounding matter and forms these triangular clouds of gas and dust. With Webb, we’re seeing more details that were hidden by dust than ever before. The regions that are orange are behind thicker layers of dust, and the regions that are blue are behind thinner layers of dust. Webb’s near-infrared images help us see more through dust—and figure out what’s going on within these dense regions in great detail for the first time. What else has Webb shown us in our Milky Way galaxy?
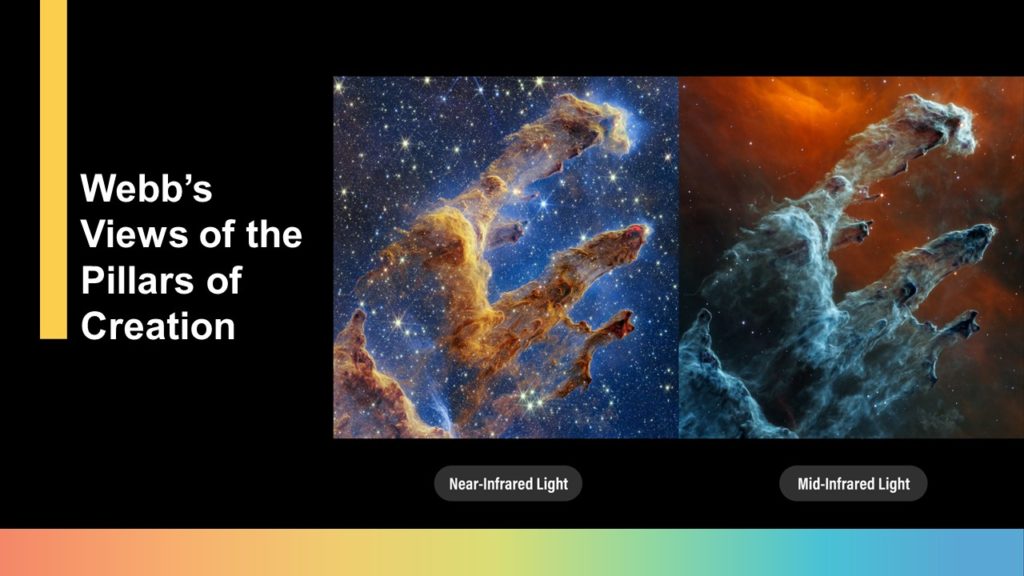
Webb captured the iconic Pillars of Creation within the Eagle Nebula last year. Infrared light shows many more stars—and a lot more dust. Let’s compare these images. Webb’s near-infrared image at left allows us to peer through more of the cool interstellar gas and dust in this star-forming region. Near-infrared light also allows us to see many more stars, including stars that are actively forming. At right, interstellar dust is practically everywhere! This is the power of mid-infrared light: It shows us more of the dust. Remember, these images are of the same region. The densest areas of dust at right are the darkest shades of gray. Stars that are still forming, but just barely breaking free of the dust, appear as red orbs at the tips of the dusty pillars. If this image looks familiar, it might be because NASA’s Hubble Space Telescope captured the same scene in 1995 and 2014. By adding new data in infrared light, researchers can identify far more precise counts of newly formed stars, along with the quantities of gas and dust in the region. This new information from Webb will help astronomers revamp their star formation models. Over time, we’ll have a clearer understanding of how stars form and burst out of these dusty clouds over millions of years.
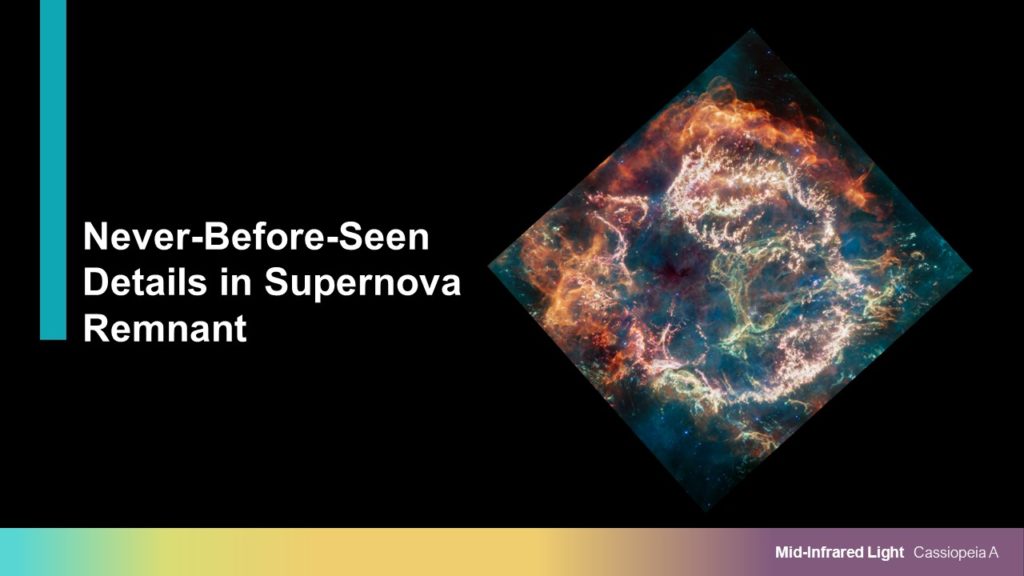
Webb took this image in mid-infrared light. This is supernova remnant Cassiopeia A, or Cas A. Everything you see here was created by a massive star that exploded 340 years ago from our perspective on Earth. Cas A is a young supernova remnant in our galaxy—and Webb has provided incredible new details about it. On the bubble’s exterior, particularly at the top and left, are curtains of material that appear orange and red due to emission from warm dust. This marks where ejected material from the exploded star is ramming into gas and dust that the star expelled earlier. A little farther in are filaments of bright pink that are studded with clumps and knots. They represent material from the star itself, which is shining due to a mix of heavy elements, such as oxygen, argon, and neon, as well as dust emission. The exploded star’s material can also be seen as fainter wisps near the cavity’s interior: Look for the green loop that extends across the right side of the central cavity.
Cas A may help answer many science questions. The first is: Where does cosmic dust come from? Let’s take a moment to explore this fundamental question. Observations have found that even very young galaxies in the early universe are suffused with massive quantities of dust. It’s difficult to explain the origins of this dust without considering supernovas, which spew large quantities of heavy elements—the building blocks of dust—across space.
Supernovas are also crucial for life as we know it. They spread elements, like the calcium we find in our bones and the iron in our blood, across interstellar space, seeding new generations of stars and planets. Existing observations of supernovas have not been able to conclusively explain the amount of dust we see in those early galaxies. By studying Cas A with Webb, astronomers hope to gain a better understanding of supernova dust content—and everything else that follows!
The exploded star’s material can also be seen as fainter wisps near the cavity’s interior: Look for the green loop that extends across the right side of the central cavity. Cas A may help answer many science questions. The first is: Where does cosmic dust come from? Let’s take a moment to explore this fundamental question. Observations have found that even very young galaxies in the early universe are suffused with massive quantities of dust. It’s difficult to explain the origins of this dust without considering supernovas, which spew large quantities of heavy elements—the building blocks of dust—across space. Supernovas are also crucial for life as we know it. They spread elements, like the calcium we find in our bones and the iron in our blood, across interstellar space, seeding new generations of stars and planets. Existing observations of supernovas have not been able to conclusively explain the amount of dust we see in those early galaxies. By studying Cas A with Webb, astronomers hope to gain a better understanding of supernova dust content—and everything else that follows!
Webb captures nearby and faraway galaxies
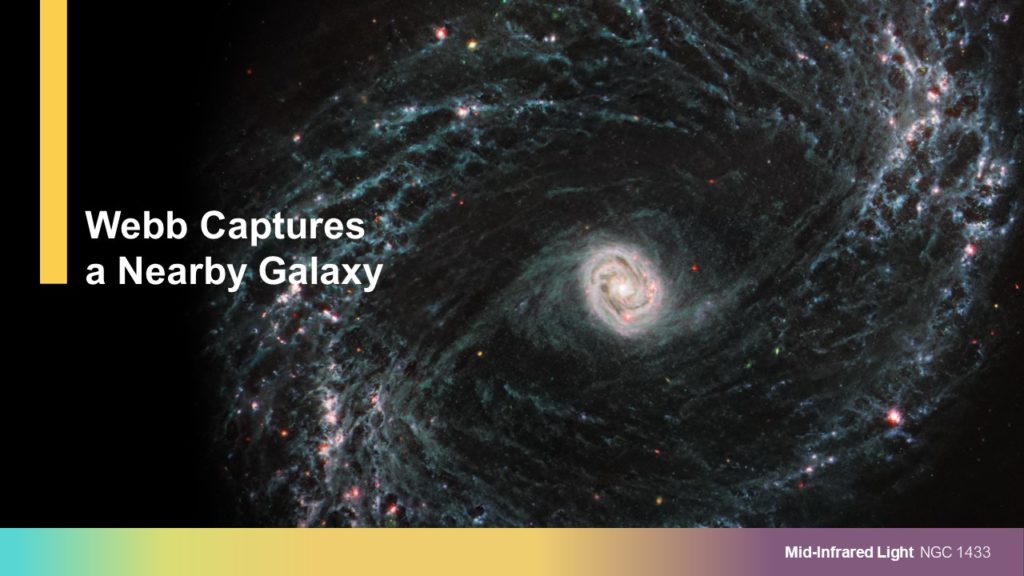
This is Webb’s observation of NGC 1433, a spiral galaxy that is only 46 million light-years away. While that may seem far away, it’s actually really close! The universe is VAST. Just look at the detail in this image—there is so much to explore. Webb’s view of this galaxy might also look somewhat unusual. That’s because the telescope observed the galaxy in mid-infrared light. As a result, we’re seeing more of the dark dust lanes in this galaxy, along with its gas and stars. Researchers have already observed many nearby spiral galaxies with Webb—and have been struck by the clarity and detail in its images. There’s still so much to learn! Let’s zoom out on another region of the sky for a very different view of galaxies.
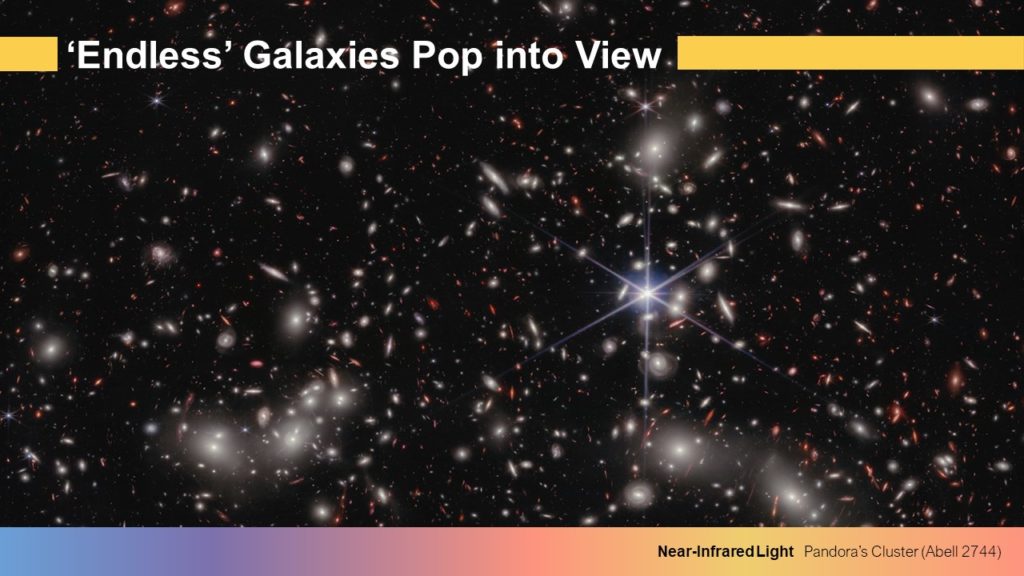
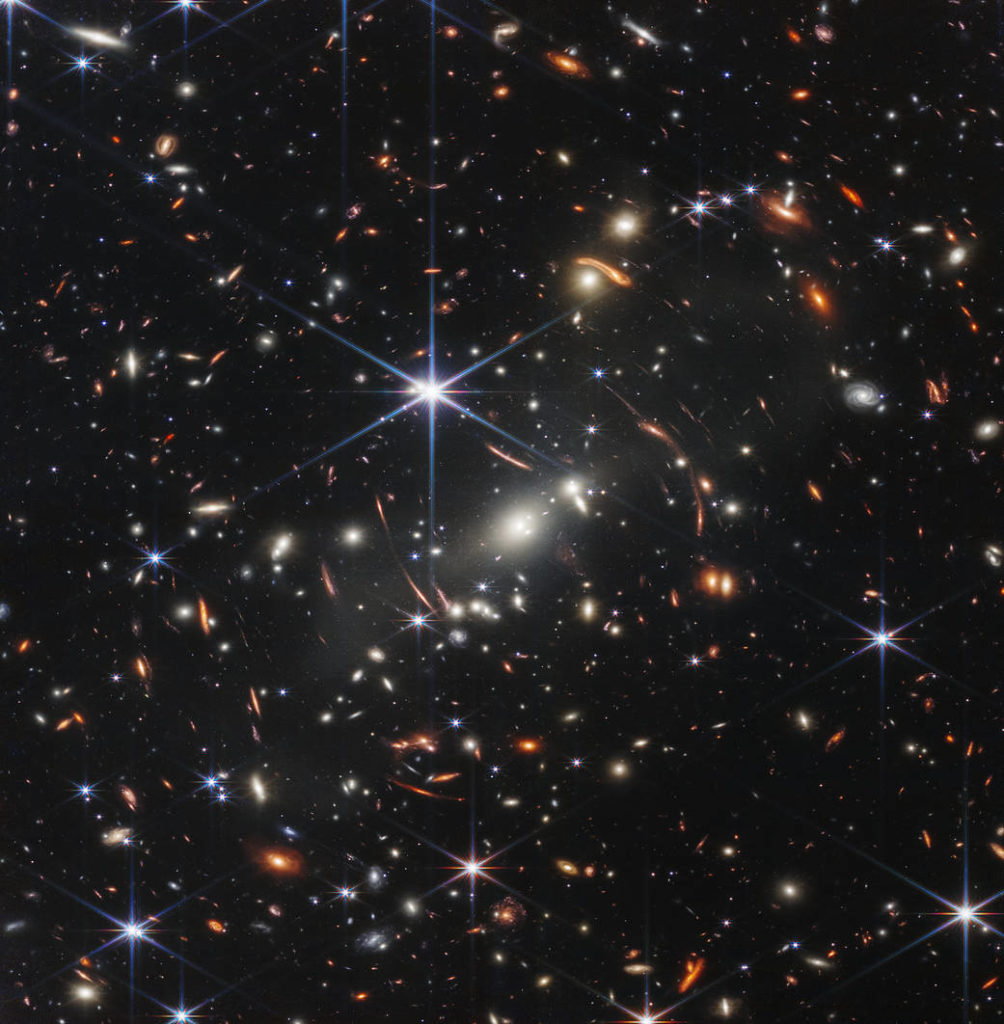
I promised that Webb can see many more galaxies! This view is known as Pandora’s Cluster. It’s a collection of thousands of galaxies that are bound together by gravity. The gravity in Pandora’s Cluster warps space around it, acting like a lens to magnify and distort galaxies behind it. Let’s look at the most distant galaxies in more detail.
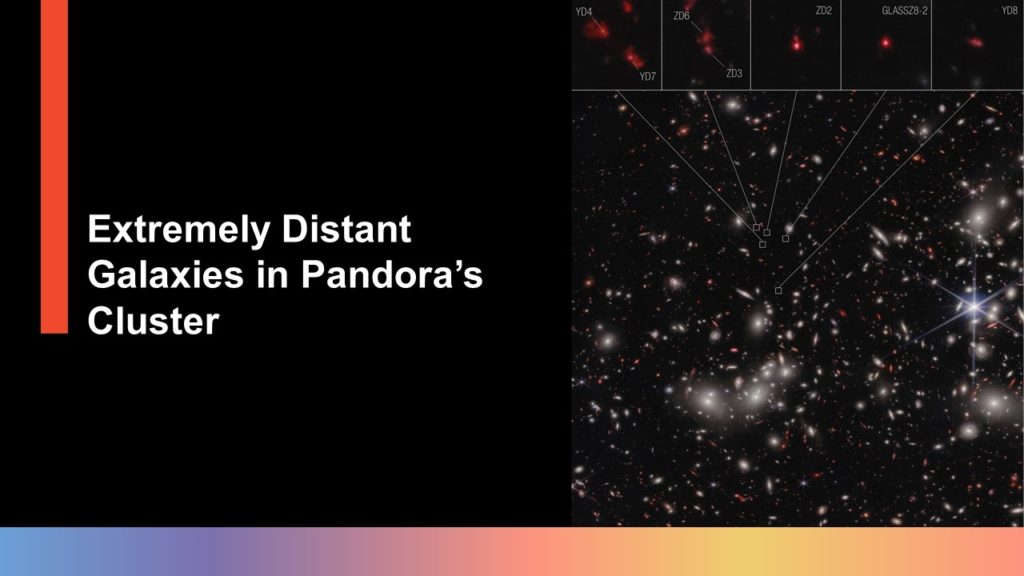
The seven red galaxies that run at the top of this image are the most distant in this field. They were all confirmed to be part of a cluster, and since they exist early in the universe’s history—just 650 million years after the big bang—they’re known as a protocluster. How do we know they’re associated? Astronomers measured the velocities, or speeds, of all seven galaxies with Webb’s precise data known as spectra and confidently confirmed that they are moving slowly enough that they are bound together. Astronomers also used Webb’s data to calculate the cluster’s future development. They found it will likely grow in size and mass, and eventually become a full-fledged galaxy cluster. That means it will become even more massive! Before Webb, exploring how large galaxy clusters came together was difficult, since the expansion of the universe stretched the young galaxies’ visible light into infrared light. Webb’s infrared instruments were developed specifically to fill in these gaps, and now, Webb is helping us fill in the history of galaxies at the beginning of the universe! Let’s explore black holes next.
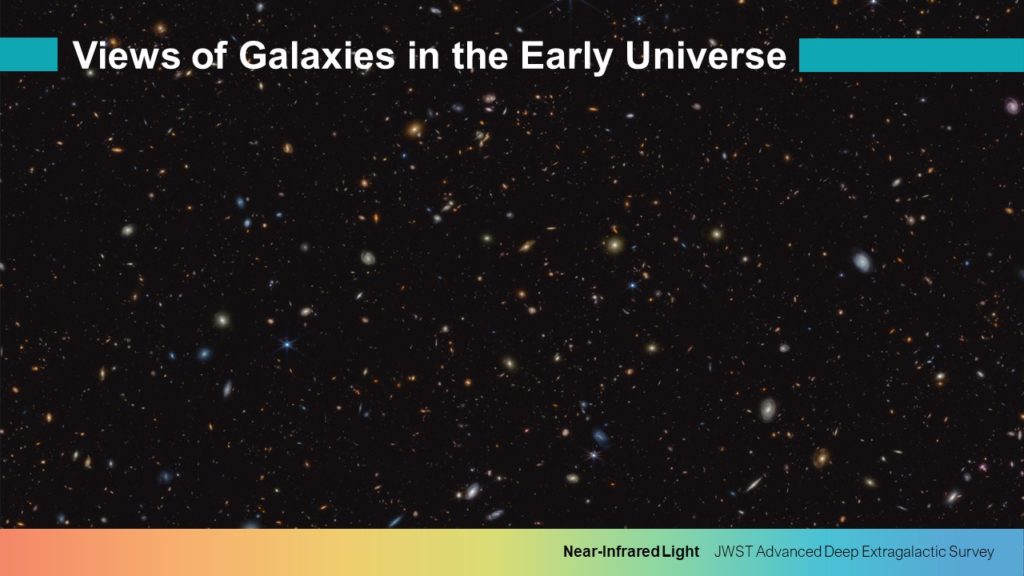
Webb has already sent back images and data from some of the earliest galaxies in the universe. This is why its specialization in infrared light is so important! Light from some of the galaxies shown here has taken more than 13.4 billion years to reach us. Some of these galaxies date back to less than 650 million years after the big bang. Webb’s data are so accurate that we can be absolutely confident of their distances. Webb spent more than 10 days observing this field. The region is 15 times larger than the deepest infrared images produced by the Hubble Space Telescope, and is even deeper and sharper. In the full field of view, which is wider than the close-up shown, Webb captured nearly 100,000 galaxies. Before Webb, there were only a few dozen galaxies observed when the universe was younger than 650 million years old, but Webb has now uncovered nearly a thousand of these extremely distant galaxies based on their colors. Their sheer number based on their colors is far beyond predictions made before Webb’s launch. The new observatory’s exquisite resolution and sensitivity are allowing astronomers to view these distant galaxies in more detail than ever before.

Webb is conducting many surveys of the early universe, using different strategies for each one. In this survey, called JADES, Webb has found the faintest galaxies ever seen before with its infrared light observations. The gold standard for measuring distances to early galaxies is to use data known as spectra to look for signatures that atoms in those early galaxies stamp on the light, which then travels through space. These color signatures are stretched out, or redshifted, as the universe expands. Measuring how much they have been stretched tells us how much the universe has expanded since the light began its journey to us. Since we know the expansion rate of the universe, this tells us how long the light has been traveling to us, or how many light-years away it is.
These spectra abruptly cut off at a critical wavelength, where neutral hydrogen gas between us and the galaxy absorbs almost all of the light at wavelengths shorter than this critical point. By measuring where this critical wavelength appears, scientists can directly measure the redshift and distance of these early galaxies. Webb’s NIRSpec instrument yielded a precise measurement of how long ago the galaxies’ emitted their light. Two galaxies in this picture are particularly special. The oldest of these galaxies dates back to 325 million years after the big bang. These are some of the faintest and most distant galaxies anyone has ever viewed!
These galaxies were very different than those nearer to us—they likely started off with only hydrogen and helium, but over the history of the universe, massive stars in galaxies were able to produce all of the elements necessary for planets—and life. These are just two galaxies, while over a dozen have been captured from when the universe was younger than 500 million years old. Webb is already showing us that many early galaxies are making hundreds of new stars every year, far above the rate of two per year we estimate in our own Milky Way galaxy.
But these new data can raise even more questions: Are these galaxies too big, too numerous, or too bright? Will Webb’s data change the way we think about how galaxies grew in the early universe? Is it easier to make stars in the early universe than we thought? Do new stars tend to be bigger and brighter in the early universe than they are today? While it is still too soon to answer any of these questions definitively, more data are coming down from Webb every day that will help researchers pin down the answers. With Webb, we can now search for—and analyze—far-flung galaxies in detail for the first time.
The journey has just begun…
Strap in! With Webb, we’re about to learn a whole lot more about the earliest galaxies in the universe. We’ll learn how quickly they grow and form—and how galaxies were able to produce all of the elements necessary for planets and life itself. In the years to come, Webb will help us learn more about everything in the universe, including its overall structure, the populations, and characteristics of galaxies near and far, and the demographics and characteristics of stars … plus, we’ll soon explore many more distant planets in great detail.
After a near-perfect launch, Webb is projected to have a 20-year lifetime. This is thanks to 20,000 engineers and scientists across 14 countries who worked together to achieve incredible technical accomplishments. Thousands of astronomers around the world are working with Webb’s images and data to unravel some of the universe’s greatest mysteries. Our journey began 13.8 billion years ago, and now, with Webb, we have the technology to study the origins of everything that exists.
Webb’s success is owed to decades of planning and support by the mission partners: NASA, the European Space Agency (ESA), and the Canadian Space Agency (CSA). The Space Telescope Science Institute (STScI) is home to Webb’s Mission Operations Center—more on that in a bit—and hosts Webb’s Science Operations Center. The best part? Official news and new images are released regularly! The longer Webb operates, the more we’ll continue to learn about the universe. This exciting new chapter in astronomy has only just begun!
Source: https://webbtelescope.org/news/milestones/first-anniversary